Why Is The Crypto Market Down Today?

0
0

The total crypto market cap (TOTAL) was hit by a minor decline today as digital assets followed the traditional market’s cues. Bitcoin (BTC) faced a similar, albeit smaller, decline while Kite (KITE) marked a 12% decline, despite a new ATH.
In the news today:-
- Jack Dorsey announced that Block will cut more than 4,000 jobs, reducing its workforce from over 10,000 to under 6,000 employees. He said the layoffs are linked to AI-driven efficiencies, not financial distress, as gross profit and profitability continue to improve.
- Anthropic CEO Dario Amodei rejected the Pentagon’s demand for unrestricted military use of its AI, risking removal from the US military supply chain. He called the government’s stance contradictory, saying it labels Anthropic a security risk while deeming its Claude AI vital to national security.
The Crypto Market Is Stable
The total crypto market cap declined by $19 billion, settling at $2.31 trillion at the time of writing. The pullback highlights crypto’s behavior as a high-beta risk asset. TOTAL continues to move in close alignment with broader macroeconomic sentiment and equity market volatility.
If investors fail to defend the $2.31 trillion support level, downside risk may accelerate. A breakdown could push TOTAL back toward $2.22 trillion. Such a move would likely reflect rising panic selling and weakening confidence across the broader cryptocurrency market.
Want more token insights like this? Sign up for Editor Harsh Notariya’s Daily Crypto Newsletter here.
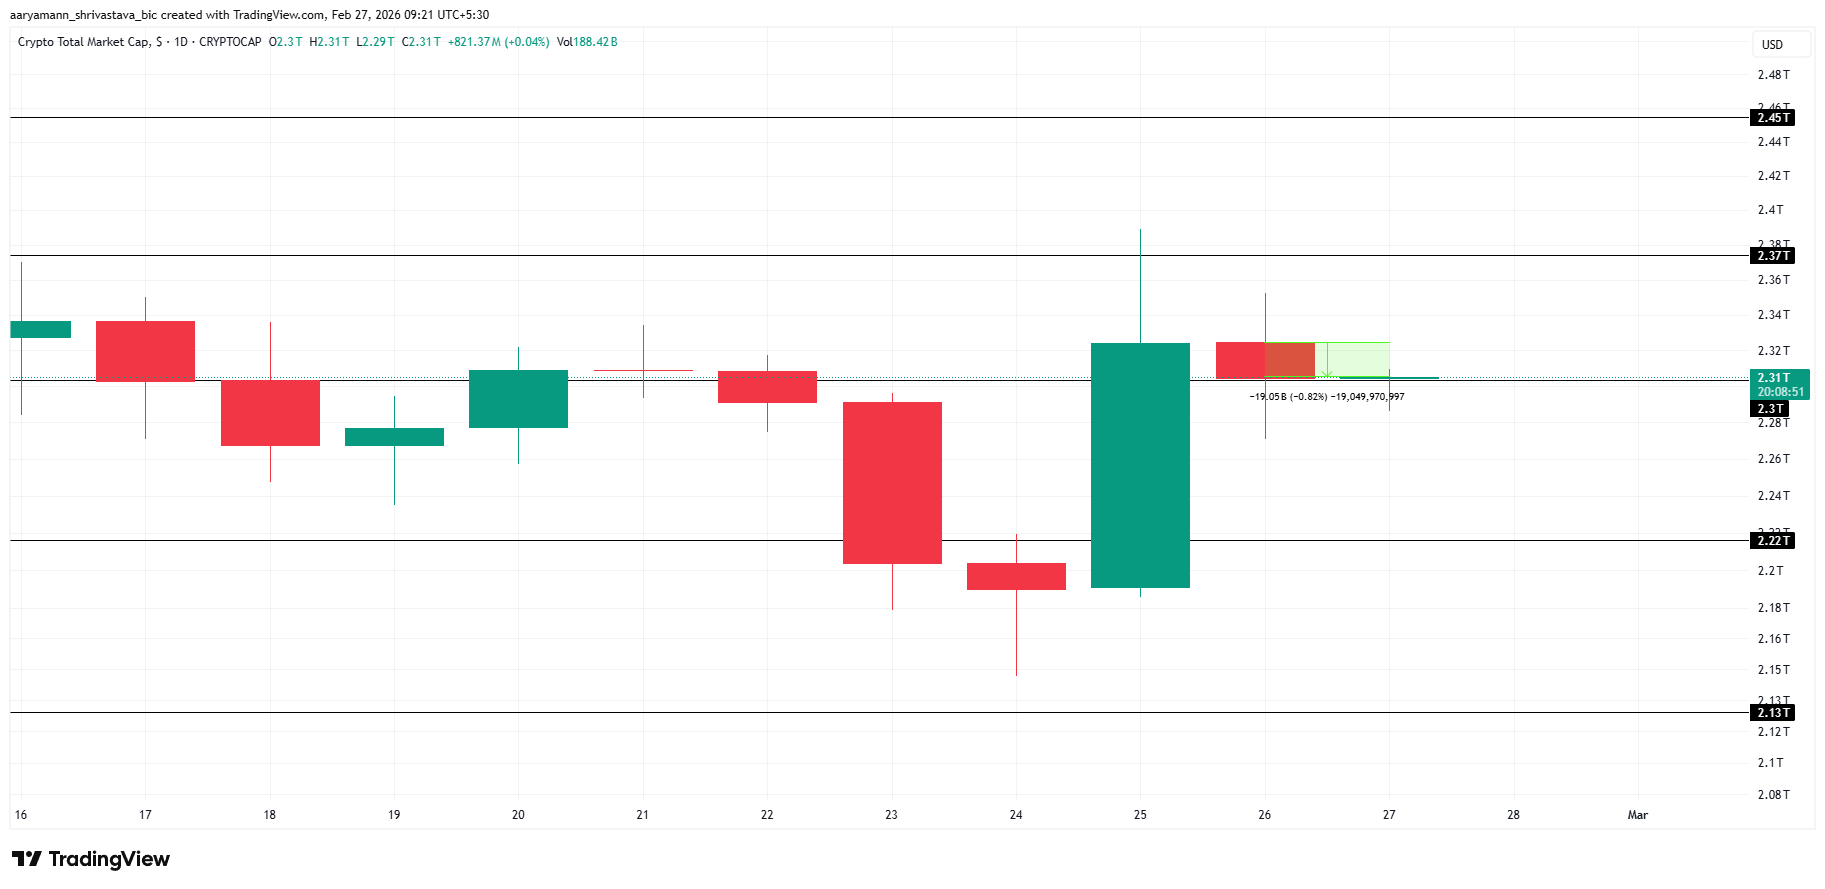 TOTAL Price Analysis. Source: TradingView
However, the decline may represent consolidation following Wednesday’s rally. Stabilization above $2.31 trillion would signal resilience. Renewed buying pressure could lift TOTAL toward $2.37 trillion. A decisive breach of that resistance would strengthen short-term bullish momentum across major digital assets.
Bitcoin Is Within Its Range
Bitcoin price appears poised to retest the $66,224 support level as broader market sentiment remains fragile. The Chaikin Money Flow indicator shows weakening inflows, signaling reduced buying pressure. Soft capital movement suggests limited conviction among traders amid ongoing macroeconomic uncertainty.
Weak inflows often precede downside volatility in the crypto market. If support at $66,224 fails, Bitcoin could slip below $65,000. A decisive breakdown may expose BTC to the next key level at $62,893, reinforcing short-term bearish momentum.
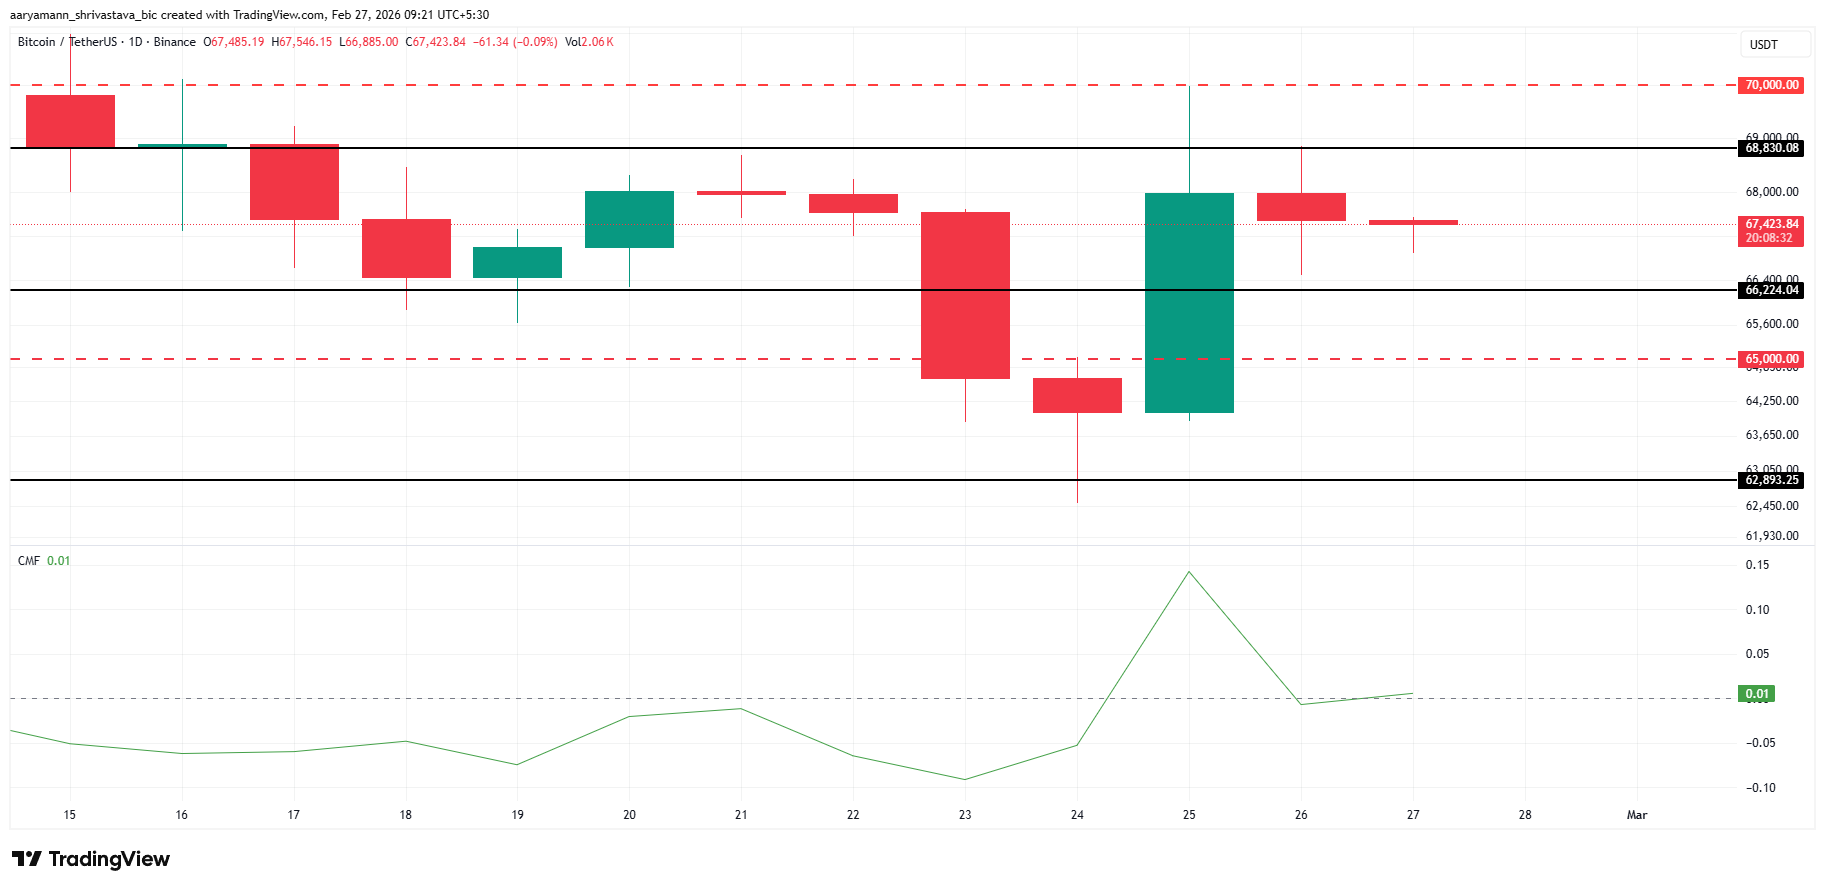 Bitcoin Price Analysis. Source: TradingView
Conversely, recovery remains possible if buyers regain control. A breakout above $68,830 would signal renewed strength. Sustained trading toward $70,000 would invalidate the bearish outlook and restore bullish structure in Bitcoin price action.
Kite Forms New ATH
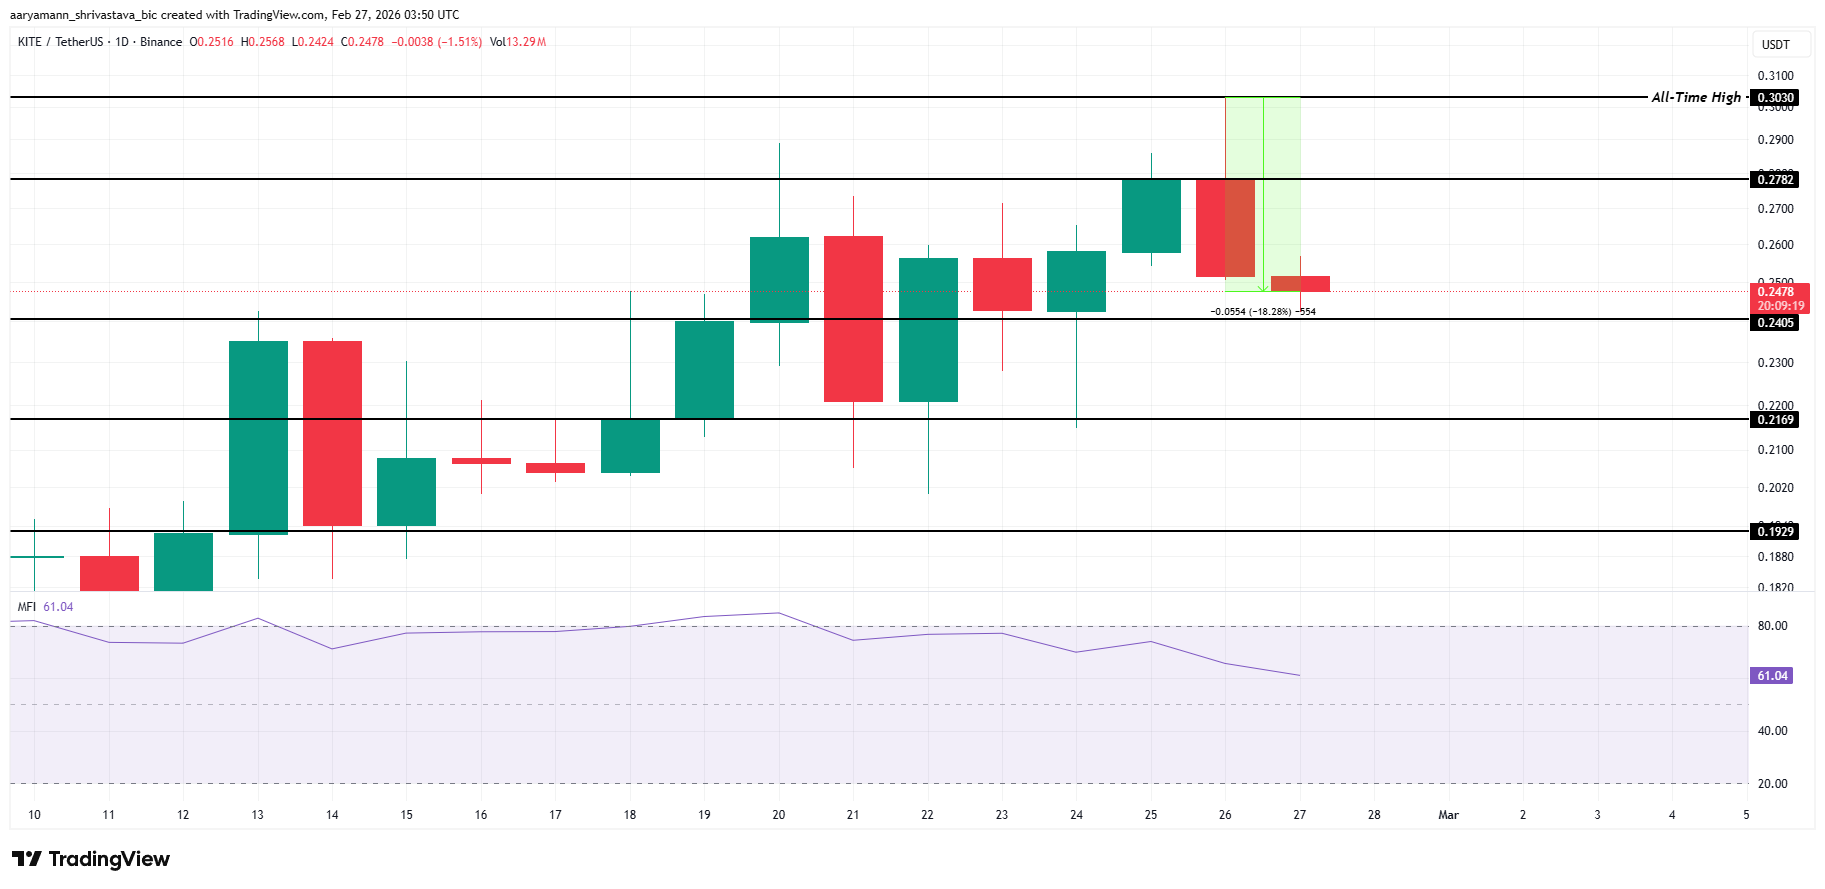
KITE experienced extreme volatility within 24 hours, first reaching a new all-time high of $0.303 before declining 18%. The token now trades at $0.247 at the time of writing. Rapid price swings highlight speculative interest and increased short-term risk in the broader crypto market.
The Money Flow Index is trending lower, signaling weakening buying pressure. This indicator measures capital inflows and outflows based on price and volume. Continued decline may push KITE below the $0.240 support level. A breakdown could expose the next downside target near $0.216.
 KITE Price Analysis. Source: TradingView
However, recovery remains possible if bearish momentum fades. A strong defense of $0.240 could trigger renewed demand. Sustained buying may lift KITE toward $0.278. Clearing that resistance would invalidate the bearish outlook and position the token closer to another all-time high attempt.
0
0


 Manage all your crypto, NFT and DeFi from one place
Securely connect the portfolio you’re using to start.


0
0

