Uniswap Crowned the First DEX to Hit $3T Volume, UNI Price to $10?
0
0
Uniswap UNI $5.36 24h volatility: 0.6% Market cap: $3.22 B Vol. 24h: $165.66 M , the governance token of the largest decentralized exchange, has gained nearly 50% in just a few days. After dipping to a yearly low of $4.70 on May 8, UNI now trades at around $7.26, up 3% in the past day.
This surge coincides with Uniswap becoming the first DEX to surpass $3 trillion in cumulative trading volume.
Uniswap is the first DEX to $3T volume 🦄
Bet its the first to 10
Grateful to everyone who swapped along the way as we decentralize the global finance system 🌐 pic.twitter.com/945Ab0Jpsl
— Hayden Adams 🦄 (@haydenzadams) May 12, 2025
According to Dune Analytics, Uniswap currently handles about $3.3 billion in daily trading volume, capturing a 23% share of the decentralized exchange market.
While its total value locked (TVL) stands at $4.97 billion, still significantly below its 2021 high, it reflects renewed confidence in DeFi as a sector.
Meanwhile, Uniswap has announced support for Ethereum’s new EIP-7702 standard, a move designed to streamline the user experience. Founder Hayden Adams confirmed the protocol is rolling out its own EIP-7702-enabled wallet and aiming for “one-click swaps” across the platform.
we're rolling out our own 7702 wallet and supporting other 7702 wallets through EIP 5792
with the goal being 1 click swapping for all users
— Hayden Adams 🦄 (@haydenzadams) May 12, 2025
This upgrade, part of Ethereum’s recent Pectra release, allows smart contract wallets to act like traditional EOAs (externally owned accounts), potentially boosting mainstream usability.
UNI Price Eyes $10 as Momentum Builds
UNI has broken out of a prolonged downtrend, approaching a strong resistance at $7.4. Popular crypto trader “Crypto Dream” pointed out on X that Uniswap’s recent 50% gain could be an early signal of altseason.
#UNI +50% from the bottom and growing further! They may not let you buy lower, so the alt season begins! The first important goal is $10 $UNI pic.twitter.com/hUbbTZzATY
— Crypto Dream (@_Crypto_Dream) May 10, 2025
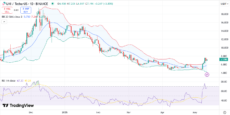
He suggested that traders may not get another chance to buy at lower levels. On the daily UNI price chart, the RSI currently sits at 67, suggesting bullish momentum. A sustained move above this level could lead the token to $10, a psychological resistance and previous support from late 2023.

UNI price chart with RSI and Bollinger Bands | Source: TradingView
Meanwhile, Bollinger Bands have widened significantly following the breakout, indicating strong price expansion. The price is holding above the midline of the bands (20-day SMA), typically a bullish sign.
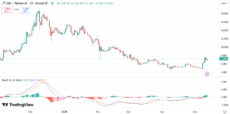
The MACD has flipped into positive territory, with the MACD line clearly crossing above the signal line. However, a brief consolidation near $7 suggests the market may pause before another leg higher.

UNI price chart with MACD | Source: TradingView
It is interesting to note that despite its current rally, UNI is still down over 84% from its all-time high of $45 in May 2021.
The post Uniswap Crowned the First DEX to Hit $3T Volume, UNI Price to $10? appeared first on Coinspeaker.
0
0
 Manage all your crypto, NFT and DeFi from one place
Securely connect the portfolio you’re using to start.


