Bitcoin (BTC) Price Crashes Below $105K: Will Buyers Take Charge?

0
0
As Israel launched a military strike on Iran in the late hours of June 12, the global risk assets saw a major drop in their values. According to the data by CoinMarketCap, Bitcoin BTC $104 850 24h volatility: 2.1% Market cap: $2.08 T Vol. 24h: $48.05 B price plummeted 2.5% to $104,937 at the time of writing.
The sell-off erased nearly $170 billion from the market cap of the world’s largest cryptocurrency, which now sits at $2.08 trillion. The move triggered mass liquidation as traders sought refuge amid rising uncertainty.
Interestingly, the Binance BTC Net Taker Volume hit -$197 million, the lowest since June 6. This metric reveals a flood of aggressive sell orders, confirming widespread fear. Funding rates also plunged into negative territory on Binance Futures, suggesting short sellers are now paying a premium to hold their positions.
Notably, past events of similar sell-side imbalances have often marked short-term bottoms. Earlier this month, BTC recovered 4% within 24 hours of a similar capitulation.
CryptoQuant CEO Ki Young Ju noted that despite the short-term dips, long-term holders accumulated over 881,000 BTC in the past month.
#Bitcoin long-term holders added 881,578 BTC over the past 30 days. pic.twitter.com/0503O8acpm
— Ki Young Ju (@ki_young_ju) June 13, 2025
This aligns with ETF inflow data. More than $970 million has entered US-listed Bitcoin ETFs in the last three days.
Analysts on X suggest that stablecoin reserves are high and social sentiment is at a 7-month peak. They hint that the market may be bracing for a bullish reversal.
BTC Price Outlook
On the 4-hour BTC price chart, the RSI is hovering near 37, signaling Bitcoin is approaching oversold territory, which may attract dip buyers. If Bitcoin manages to close above the $105,000 level, traders could see a short-term rally to $107,500.
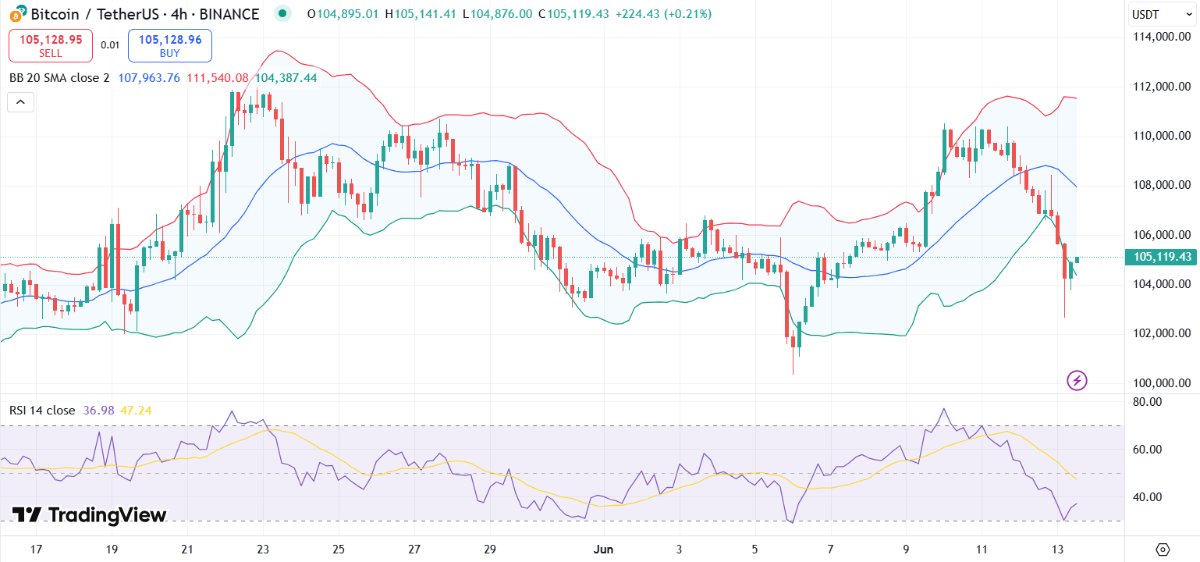
BTC price chart with RSI and Bollinger Bands. Source: TradingView
Meanwhile, the price is testing the lower Bollinger Band around $104,387. A rebound above the mid-band resistance (20-day SMA) of $107,963 would confirm a bullish reversal.
The MACD is flashing bearish momentum, with the MACD line below the signal line. The declining histogram bars suggest further downside unless a crossover occurs. If BTC fails to hold support near $104,800, the next key level lies at $102,500.
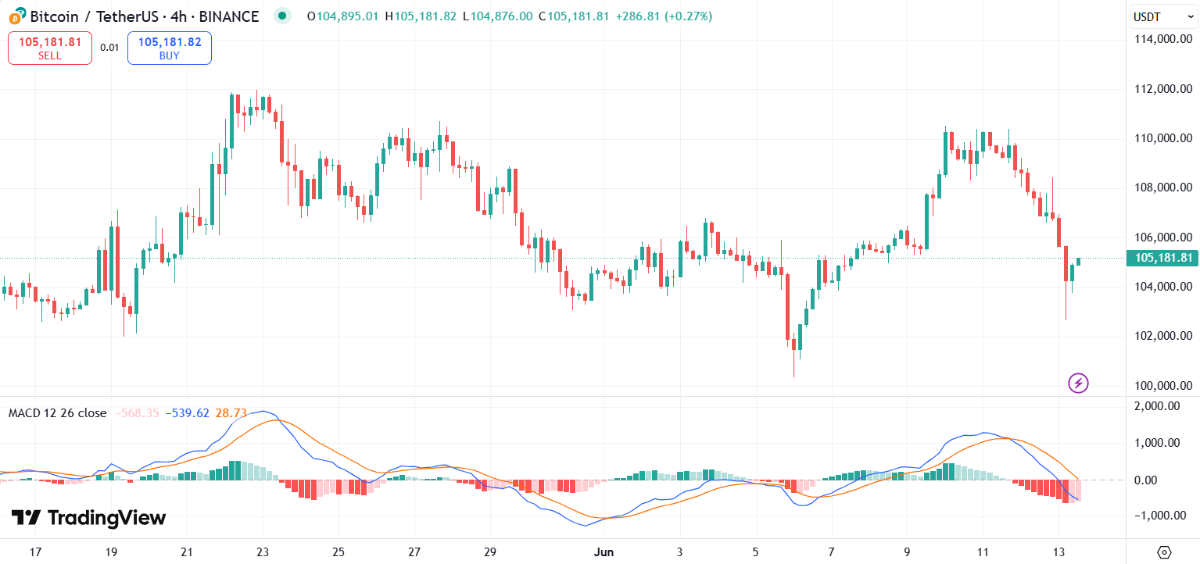
BTC price chart with MACD. Source: TradingView
BTC Bull Presale Gains Momentum as BTC Eyes Rally
As Bitcoin navigates the market uncertainty, BTC Bull ($BTCBULL), a distinctive meme coin, is capturing significant attention. This project is notable for its simple yet impactful approach: aligning its value with Bitcoin’s upward trajectory.
About BTCBULL: Use Case and Tokenomics
The BTC Bull ecosystem’s native token, BTCBULL, presents a unique milestone-based presale opportunity that is directly correlated with Bitcoin’s performance.
For every $25,000 increase in Bitcoin price within the range of $100,000 to $250,000, BTCBULL holders become eligible for new rewards. These incentives include deflationary token burns and Bitcoin airdrops, designed to foster community engagement and enthusiasm.
The ultimate milestone of a major BTCBULL airdrop is set for when Bitcoin reaches $250,000.
BTCBULL Presale Details:
- Current price: $0.00256
- Funds raised: $7.1 million
- Ticker: BTCBULL
- Payment options: ETH, USDT
The crypto presale has already secured an impressive $7.1 million, progressing towards its $8.15 million target. Investors can expect a value increase for BTCBULL in less than 17 days.
Investors believing in Bitcoin price surge can add BTC Bull to their list of projects with future potential.
The post Bitcoin (BTC) Price Crashes Below $105K: Will Buyers Take Charge? appeared first on Coinspeaker.
0
0


 Manage all your crypto, NFT and DeFi from one place
Securely connect the portfolio you’re using to start.


