Bitcoin stuck under $105K amid macro shifts, WIF and Pi grab altcoin spotlight

0
0

Bitcoin held firm above the six-figure mark this week, supported by a cautiously optimistic market, though momentum stalled by week’s end as new catalysts failed to emerge.
Broader market growth continued, with the total crypto market cap rising 2.4% to $3.42 trillion by Friday.
Sentiment cooled only slightly, as the Crypto Fear and Greed Index dipped two points but remained firmly in greed territory at 71.
Most leading altcoins ended in the green, with only a few registering modest single-digit losses over the seven-day period.
What happened with Bitcoin this week?
Much of this week’s price action was dictated by shifting macroeconomic conditions, with early gains fuelled by improving geopolitical sentiment.
On Monday, May 12, Bitcoin surged to an intraday high of $105,525 after the United States and China signed a tariff de-escalation agreement in Geneva.
The deal, which took effect on May 14, saw both countries lower their respective reciprocal tariffs to 10% for a 90-day period, down from the previous rates of 145% and 125%.
The easing of trade tensions helped revive risk appetite across financial markets, lifting cryptocurrencies alongside equities.
The rally gained further traction on Tuesday following the release of April’s US Consumer Price Index (CPI) data.
Inflation cooled to 2.3% year-over-year, while monthly gains held at 0.2%, both in line with expectations.
The softer print helped calm fears of extended monetary tightening by the Federal Reserve, giving risk assets another leg up.
However, bullish momentum faded by Thursday after the US Producer Price Index (PPI) showed an unexpected 0.5% monthly decline in April, defying economists’ forecasts of a 0.2% increase.
The drop, driven entirely by a 0.7% slide in services, marked the sharpest contraction since the series began in 2009.
Bitcoin pulled back to around $102,655 following the report, paring earlier gains.
Markets turned cautious ahead of Federal Reserve Chair Jerome Powell’s remarks later that day.
While Powell reaffirmed the central bank’s commitment to its 2% inflation target, he suggested the Fed may revise its consensus statement in the coming months to reflect economic uncertainty and evolving policy outlooks better.
By Friday, Bitcoin remained above $102,000 but showed signs of stalling, as traders weighed the mixed signals from inflation data and policy commentary.
Will Bitcoin go up?
According to market watchers, Bitcoin’s ability to hold above $100,000 has reinforced its near-term support, but the lack of a decisive breakout has kept traders on edge.
Onchain analytics firm Swissblock noted in a May 16 post that Bitcoin is currently “stuck in a narrowing $101.5K–$104K range” following two failed attempts to break higher.
Without a strong move before the weekend, a decisive resolution is likely to be delayed into next week, it added.
Others echoed a similar sentiment. Market intelligence provider Santiment observed a shift in trader psychology, noting a slight rise in bearish expectations following repeated rejections at $105,000.
However, the firm pointed out that rising fear and impatience among retail participants have historically been a contrarian bullish signal.
Technical analysts are also closely watching activity on major exchanges.
According to Material Indicators, large blocks of ask liquidity have clustered between $105,000 and $110,000 on Binance, effectively capping Bitcoin’s upside in the absence of a strong catalyst. See below.
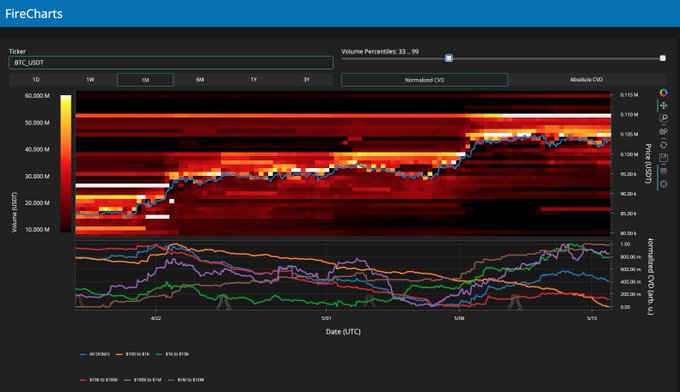
The firm expects a more sustainable move toward all-time highs only after a confirmed test of support around the $100,000 level.
However, they warned traders to stay cautious, flagging the $98,000–$100,000 range as a critical zone to monitor for potential downside tests, while cautioning against short squeezes and bull traps that could emerge in the current low-liquidity environment.
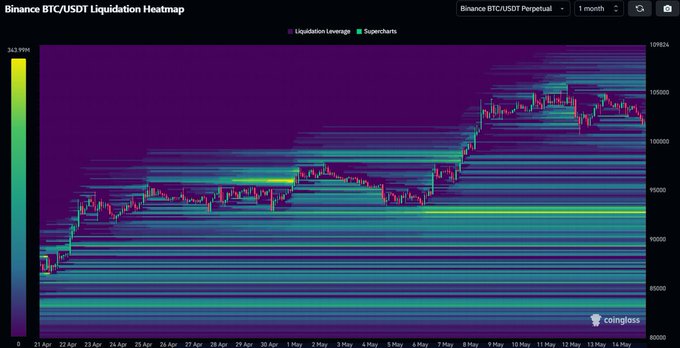
In the event of a pullback from current levels, independent trader Daan Crypto Trades pointed to $93,000 as a key level to watch, noting that Bitcoin is currently trading far from major liquidity clusters. See below.
MN Capital founder Michael van de Poppe also highlighted $98,000 as a “crucial area to hold on to” in order to maintain upward momentum.
Others like pseudonymous analyst Sudelytic noted that despite the recent pullback, long-term holders remain unmoved, with on-chain data showing a decline in the Long-Term Holder SOPR, indicating that most selling pressure is coming from short-term traders.

Bitcoin SOPR. Source: Sudelytic.
“This might just be a breather before the next leg up, Worth keeping an eye on,” the analyst added.
The broader setup points to a market holding firm but waiting for direction.
Without a fresh catalyst, price action may stay rangebound as traders gauge whether recent support levels can withstand growing short-term pressure.
At the time of writing, Bitcoin was trading at $103,993, roughly 4% below its all-time high.
A break above this level could serve as a short-term bullish catalyst if buyers manage to push the price into price discovery.
Altcoins see modest gains
Even with modest gains across the board, altcoins remain out of favour.
The altcoin season index dropped 8 points to 25, well below the threshold for an alt season.
The top performers this week, as of May 16, were:
dogwifhat
dogwifhat (WIF) has soared 53% over the past week, now trading around $1.11 with a market cap topping $1.1 billion.

Source: CoinMarketCap
One of the key reasons behind this surge seems to be renewed hype from the community, especially after news broke that Coinbase is being added to the S&P 500.
That move was seen as bullish for WIF since it’s part of Coinbase’s COIN50 Index, a collection of the top 50 digital assets listed on the platform.
There’s also been a clear uptick in futures market activity. According to CoinGlass, open interest in WIF futures has climbed to $450 million, up from just $175 million at the start of April.
On the daily chart, WIF looks like it’s been forming a round bottom pattern since early December, a bullish setup that usually points to steady gains ahead, at least going by technical analysis.
On top of that, the weighted funding rate has stayed positive for the last 8 days, a sign of strong bullish sentiment in the market.
Pi
Over the past week, Pi (PI) gained 24.5%, trading at $0.91 at the time of writing.
Its market cap stood at $5.92 billion, while daily trading volume hovered around $422 million.

Source: CoinMarketCap
The rally was mainly driven by community excitement after the Pi Foundation teased a “major announcement” set for May 14.
That teaser sparked a massive pump, with PI jumping over 200% to hit an intraday high of $1.60 on May 12, its highest price since March 2025.
But when the big reveal finally happened, which was a $100 million Pi Network venture fund to support ecosystem projects, the market wasn’t impressed.
PI quickly gave up most of its gains, dropping over 50% almost right after the news came out.
There are a couple of reasons for the sharp dip. First, the venture fund is more of a long-term play and doesn’t bring any instant benefits or price support for the token.
Second, the hype around the announcement likely led to unrealistic expectations.
This kind of price action is a textbook example of the “buy the rumor, sell the news” pattern, where investors push the price up in anticipation of big news, only to dump it once the actual announcement falls short of the hype.
Kaspa
Kaspa (KAS) held on to 18% gains over the past 7 days, trading at $0.1211 when writing. Its market cap stands at over $3.17 billion.

Source: CoinMarketCap
While no clear catalyst was identified at press time, the rally appeared to gain momentum after bulls successfully flipped the $0.12 resistance zone into support.
Renewed interest may also be tied to Kaspa’s recent “Crescendo” mainnet upgrade, which went live on May 5.
The update improved scalability and efficiency by increasing block production speed tenfold and shifting the network to a Rust-based architecture.
The post Bitcoin stuck under $105K amid macro shifts, WIF and Pi grab altcoin spotlight appeared first on Invezz
0
0


 Manage all your crypto, NFT and DeFi from one place
Securely connect the portfolio you’re using to start.

0
0


