Ether Investors Exiting CEXs as Whale Buys Soar, ETH Price to $4K Soon?

1
0
Ethereum ETH $1 845 24h volatility: 2.6% Market cap: $222.72 B Vol. 24h: $14.22 B has been gaining momentum, now trading at $2,639 after rising 1.5% in the past 24 hours. The 24-hour trading volume has jumped 40% to $23.72 billion, suggesting rising investor interest.
Notably, earlier on May 28, two newly created wallets withdrew a combined 4,838 ETH (worth roughly $13 million) from Kraken.
Another 2 newly created wallets withdrew 4,838 $ETH ($13M) from #Kraken 6 hours ago.
0x2bbeCA38b9CC8851292907af6bc28cC3BC593538
0x6087F2120dA3EC81Bc2C52929967527E79D510A2https://t.co/FB5QuaU0hp pic.twitter.com/msuuLLHUmp— Lookonchain (@lookonchain) May 28, 2025
This follows a similar activity seen on May 27, when four new wallets pulled out 4,392.6 ETH (worth around $11.7 million) from OKX. Such consistent exchange outflows indicate growing investor preference for self-custody and long-term holding strategies.
Meanwhile, whales have accumulated over 1 million ETH in the past month, signaling strong institutional confidence.
Whales have bought over 1 million #Ethereum $ETH in the past month! pic.twitter.com/CCiujnmdWq
— Ali (@ali_charts) May 27, 2025
Ether ETFs have also recorded sustained inflows recently. Data from SoSoValue shows that over the last seven trading days, these funds have attracted a cumulative $310 million.
ETH Price Outlook
Once underperforming compared to the broader crypto market, Ether has seen a notable reversal. It has surged 46% over the last 30 days, adding nearly $100 billion to its market capitalization, which now stands around $318 billion.
Despite the rally, popular analyst Michael Van de Poppe believes a major breakout is still ahead. He notes that ETH is now testing a crucial resistance range between $2,627 and $2,850.
A big breakout on $ETH is yet to happen. pic.twitter.com/IN1D8dyWwF
— Michaël van de Poppe (@CryptoMichNL) May 28, 2025
Van de Poppe suggests that a successful breakout above this resistance could send Ethereum to revisit or even exceed its all-time high of $4,891.
On the daily ETH chart, the price is approaching the upper boundary of Bollinger Bands around $2,730. The mid band (20-day SMA) is acting as short-term bullish support for the second-largest cryptocurrency.
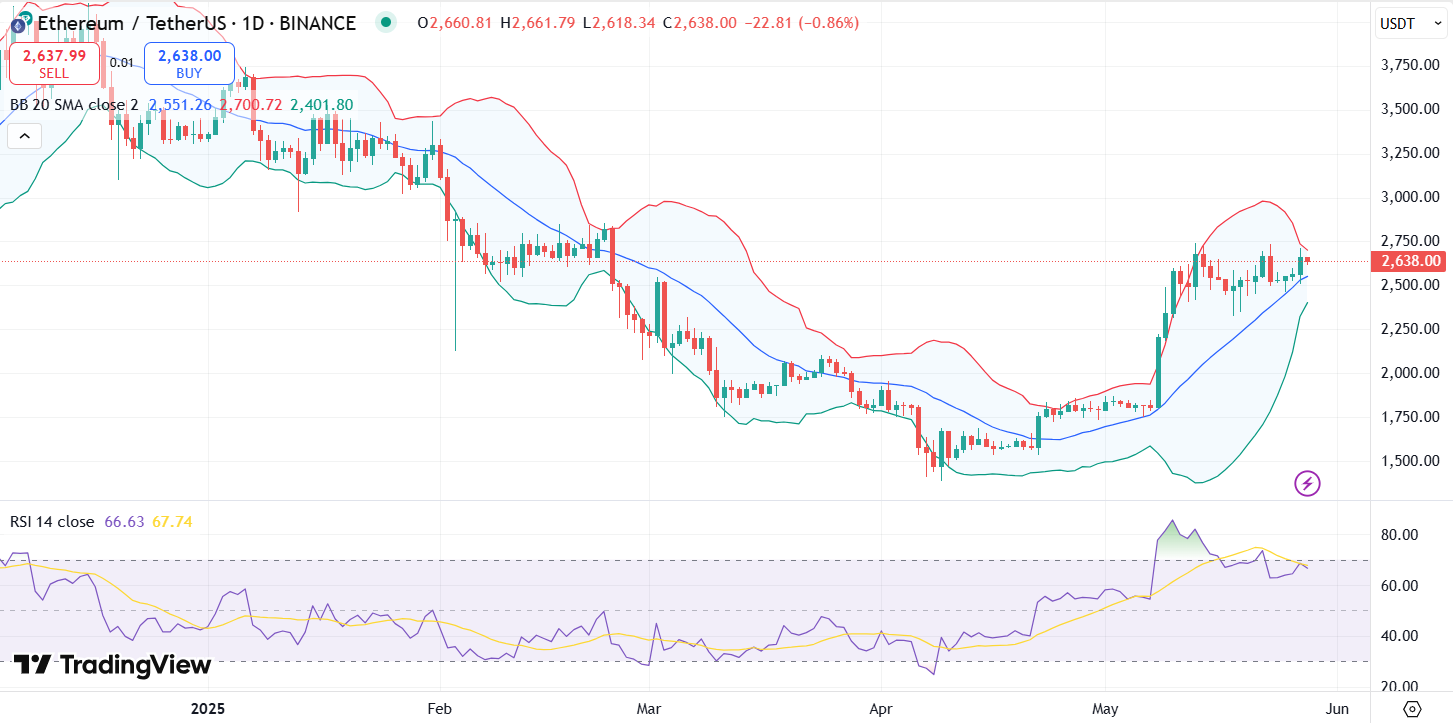
ETH price chart with RSI and Bollinger Bands | Source: TradingView
The RSI is nearing overbought territory but still leaves room for upward movement before signaling exhaustion. A break above the $2,850 resistance could confirm the bullish scenario, potentially leading ETH to $3,000.
$ETH – #Ethereum to $2,900 this week wouldn't surprise me. pic.twitter.com/0vLAoaOpPF
— Crypto Fella (@CryptoFellaTx) May 27, 2025
Well-followed trader on X Crypto Fella remarked that he wouldn’t be surprised if Ether touched $2,900 this week.
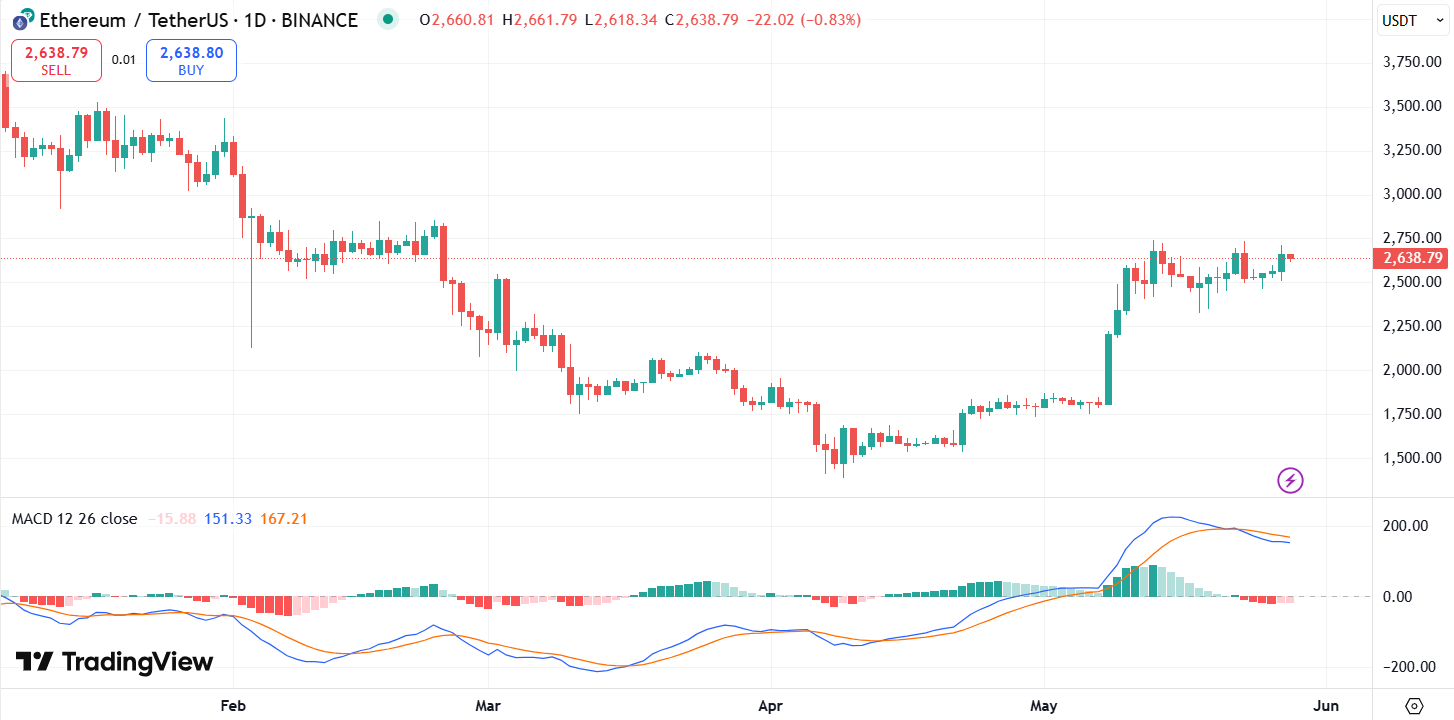
ETH price chart with RSI and Bollinger Bands | Source: TradingView
Meanwhile, the MACD histogram has flattened, and although the signal line remains above the MACD line, the gap is narrowing. This hints at a possible trend shift or brief rally ahead.
The post Ether Investors Exiting CEXs as Whale Buys Soar, ETH Price to $4K Soon? appeared first on Coinspeaker.
1
0

 Manage all your crypto, NFT and DeFi from one place
Securely connect the portfolio you’re using to start.


0
0


0
0