Why Is The Crypto Market Up Today?

0
0

The crypto market rallied past $2.40 trillion on April 8 after the US-Iran two-week ceasefire triggered a 5.26% surge from the April 6 close, squeezing $596 million in leveraged positions across the derivatives market.
Bitcoin climbed to $71,295, extending its seven-day gains to 5.4%, while Zcash (ZEC) emerged as the top performer among the top 100 with a 27% breakout backed by its highest daily volume in nearly a month.
In the news today:-
- Morgan Stanley debuts its spot Bitcoin ETF (MSBT) on NYSE Arca on April 8 with an expense ratio of 0.14%, making it the cheapest Bitcoin ETF on the market and the first from a major Wall Street bank. The firm’s $4 trillion wealth management network now has direct regulated access to Bitcoin.
- The US and Iran agreed to a Pakistan-brokered two-week ceasefire late on April 7, with peace talks scheduled for Friday in Islamabad. Oil prices dropped 8% to roughly $103 per barrel after the announcement, and Iran committed to reopening the Strait of Hormuz under military coordination.
- Circle launched its Stablecoin Payouts service for Circle Mint Singapore partners, expanding USDC-based cross-border payment infrastructure into Asia.
Crypto Market Surges as Ceasefire Fuels Risk-On Rotation
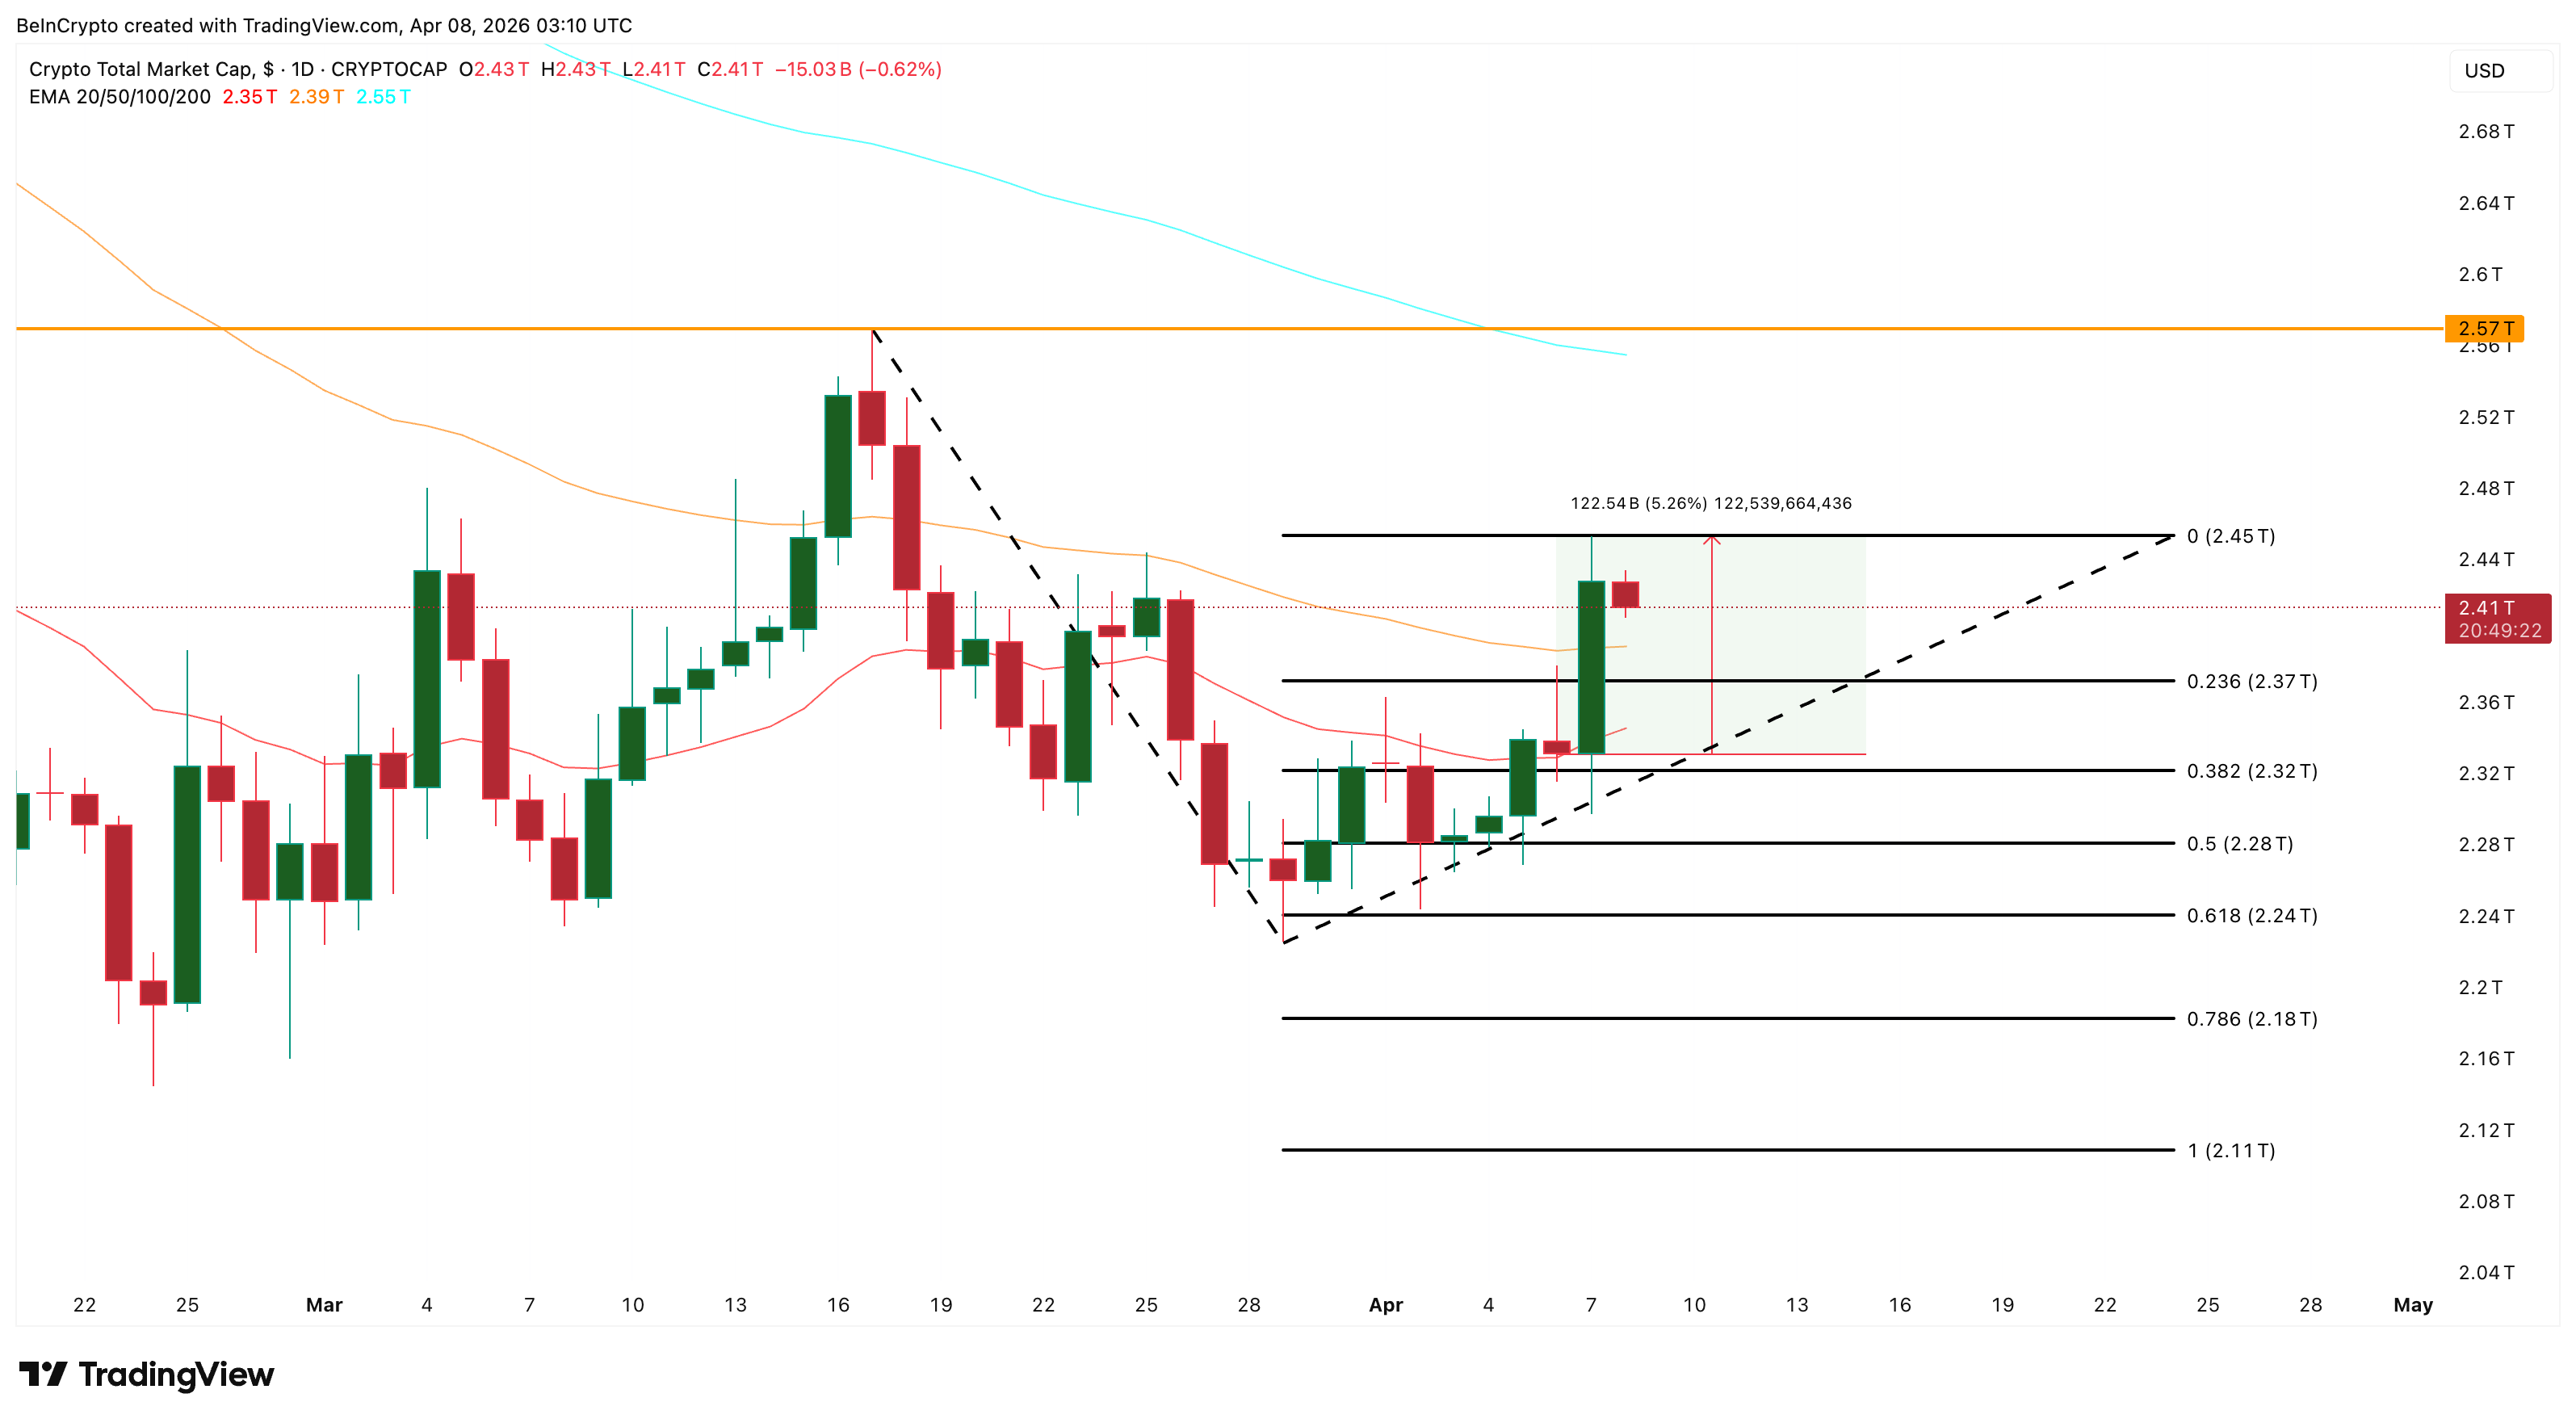
The total crypto market capitalization sits at $2.41 trillion on April 8 after rallying 5.26% from the April 6 close. The positive announcement between the US and Iran late on April 7 triggered the move, as risk capital rotated back into digital assets after weeks of conflict-driven caution.
The rally pushed TOTAL above both the 20 and 50-day exponential moving averages (EMAs), a pair of trend-following indicators that smooth price data to identify momentum shifts, for the first time since mid-March.
Want more token insights like this? Sign up for Editor Harsh Notariya’s Daily Crypto Newsletter here.
 TOTAL Crypto Market Cap Analysis: TradingView
However, the market gave back part of its gains after touching $2.45 trillion, which now stands as the ceiling for continued upside.
A daily close above that level would open the path toward $2.57 trillion. It is a zone that aligns closely with the 100-day EMA at $2.55 trillion. On the support side, the 50-day EMA at $2.39 trillion and the 0.236 Fibonacci level at $2.37 trillion form the first line of defense. The $2.28 trillion zone at the 0.5 Fibonacci level remains the strongest floor for now.
Friday’s March CPI, expected to show a war-driven spike, could test this rally if inflation concerns resurface.
A daily close above $2.45 trillion targets $2.57 trillion. A break below $2.37 trillion reopens the path toward $2.28 trillion.
Bitcoin Holds Above $71,000 as Institutional Flows Turn Positive
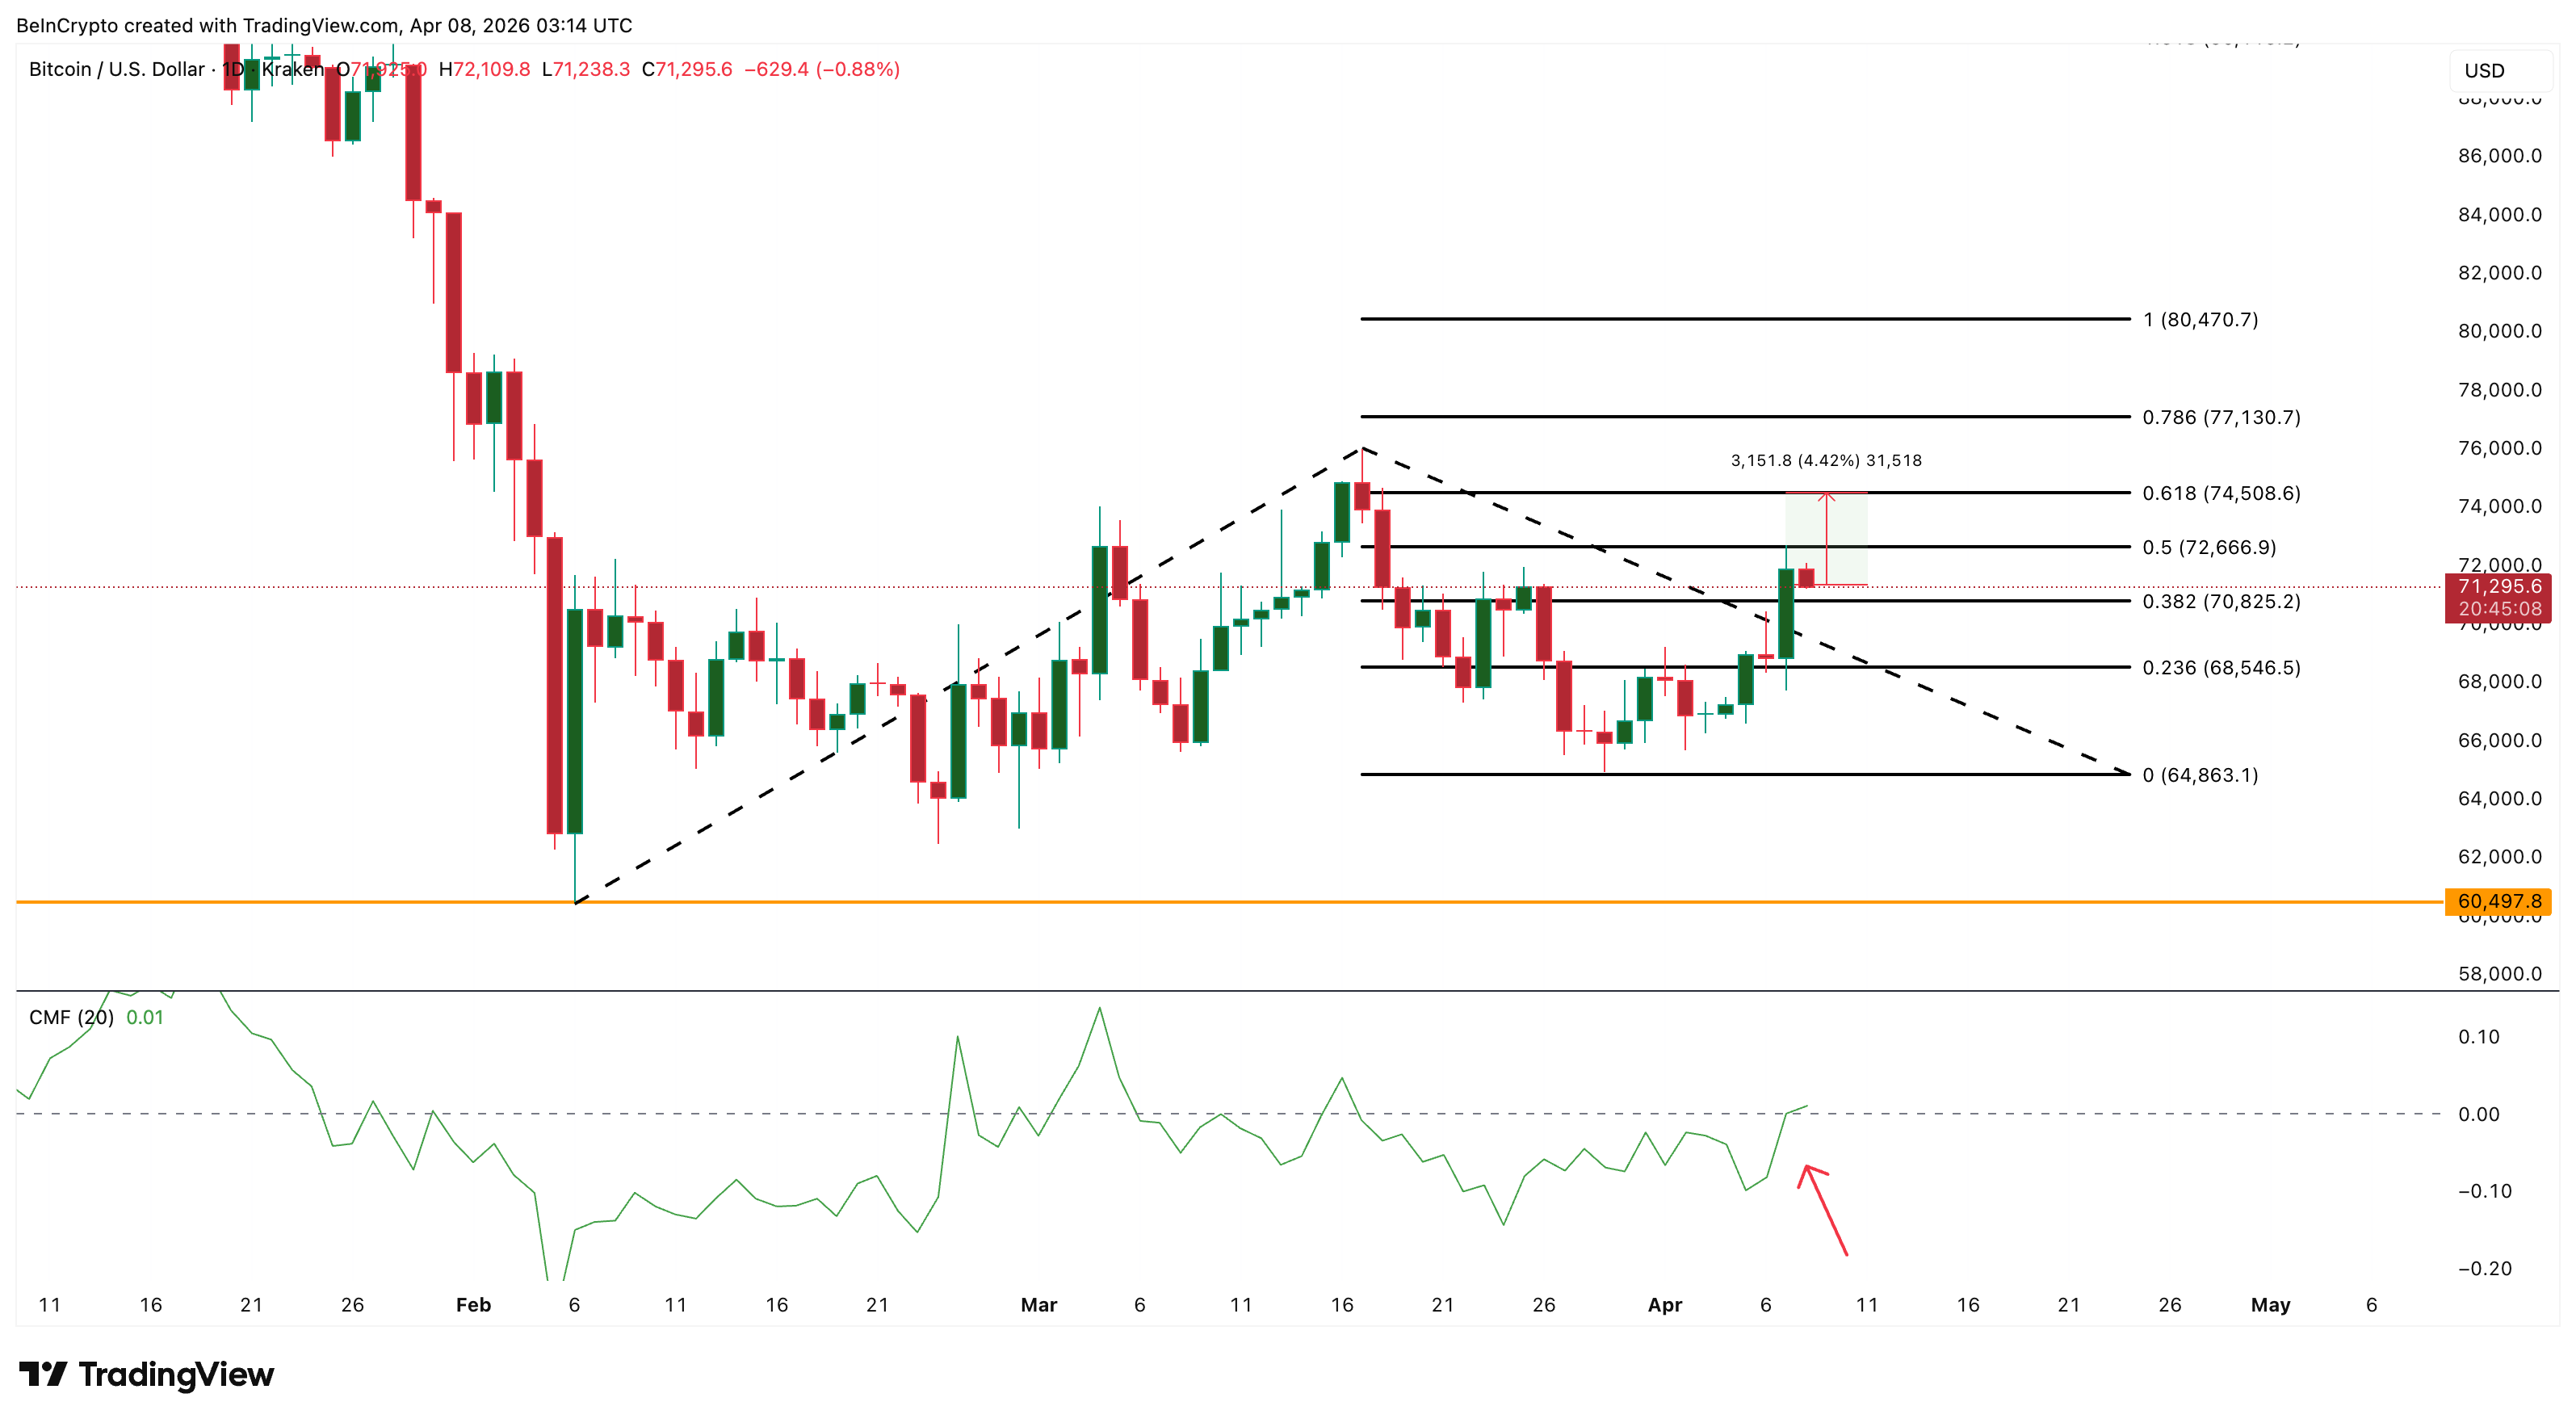
Bitcoin (BTC) trades at $71,295 on April 8, up approximately 4% over the past 24 hours. It extended its seven-day gains to 5.4%. The ceasefire-driven rally continued the uptrend that began from the February 6 low of $60,497. BTC has now sustained above $70,000 with more conviction than at any point since mid-March.
The most significant development sits below the price chart. The Chaikin Money Flow (CMF) indicator, which measures buying and selling pressure by combining price and volume data, has entered positive territory at 0.01 for the first time since mid-March. The shift suggests that institutional capital is beginning to flow back in after weeks of net outflows during the conflict. Meanwhile, Morgan Stanley’s MSBT launch today adds another institutional on-ramp that could sustain the flow shift.
 Bitcoin Price Analysis: TradingView
Resistance sits at the 0.5 Fibonacci level of $72,666. A breakout above that targets $74,508, the level BTC needs to close above on a daily basis for the bullish structure to gain traction. On the downside, $70,825 at the 0.382 Fibonacci level acts as the immediate support, followed by $69,546.
A daily close above $74,509 shifts the bias bullish toward $77,130. A close below $70,825 brings $68,547 back into focus.
Zcash (ZEC) Surges 27% on Highest Volume Since Mid-March
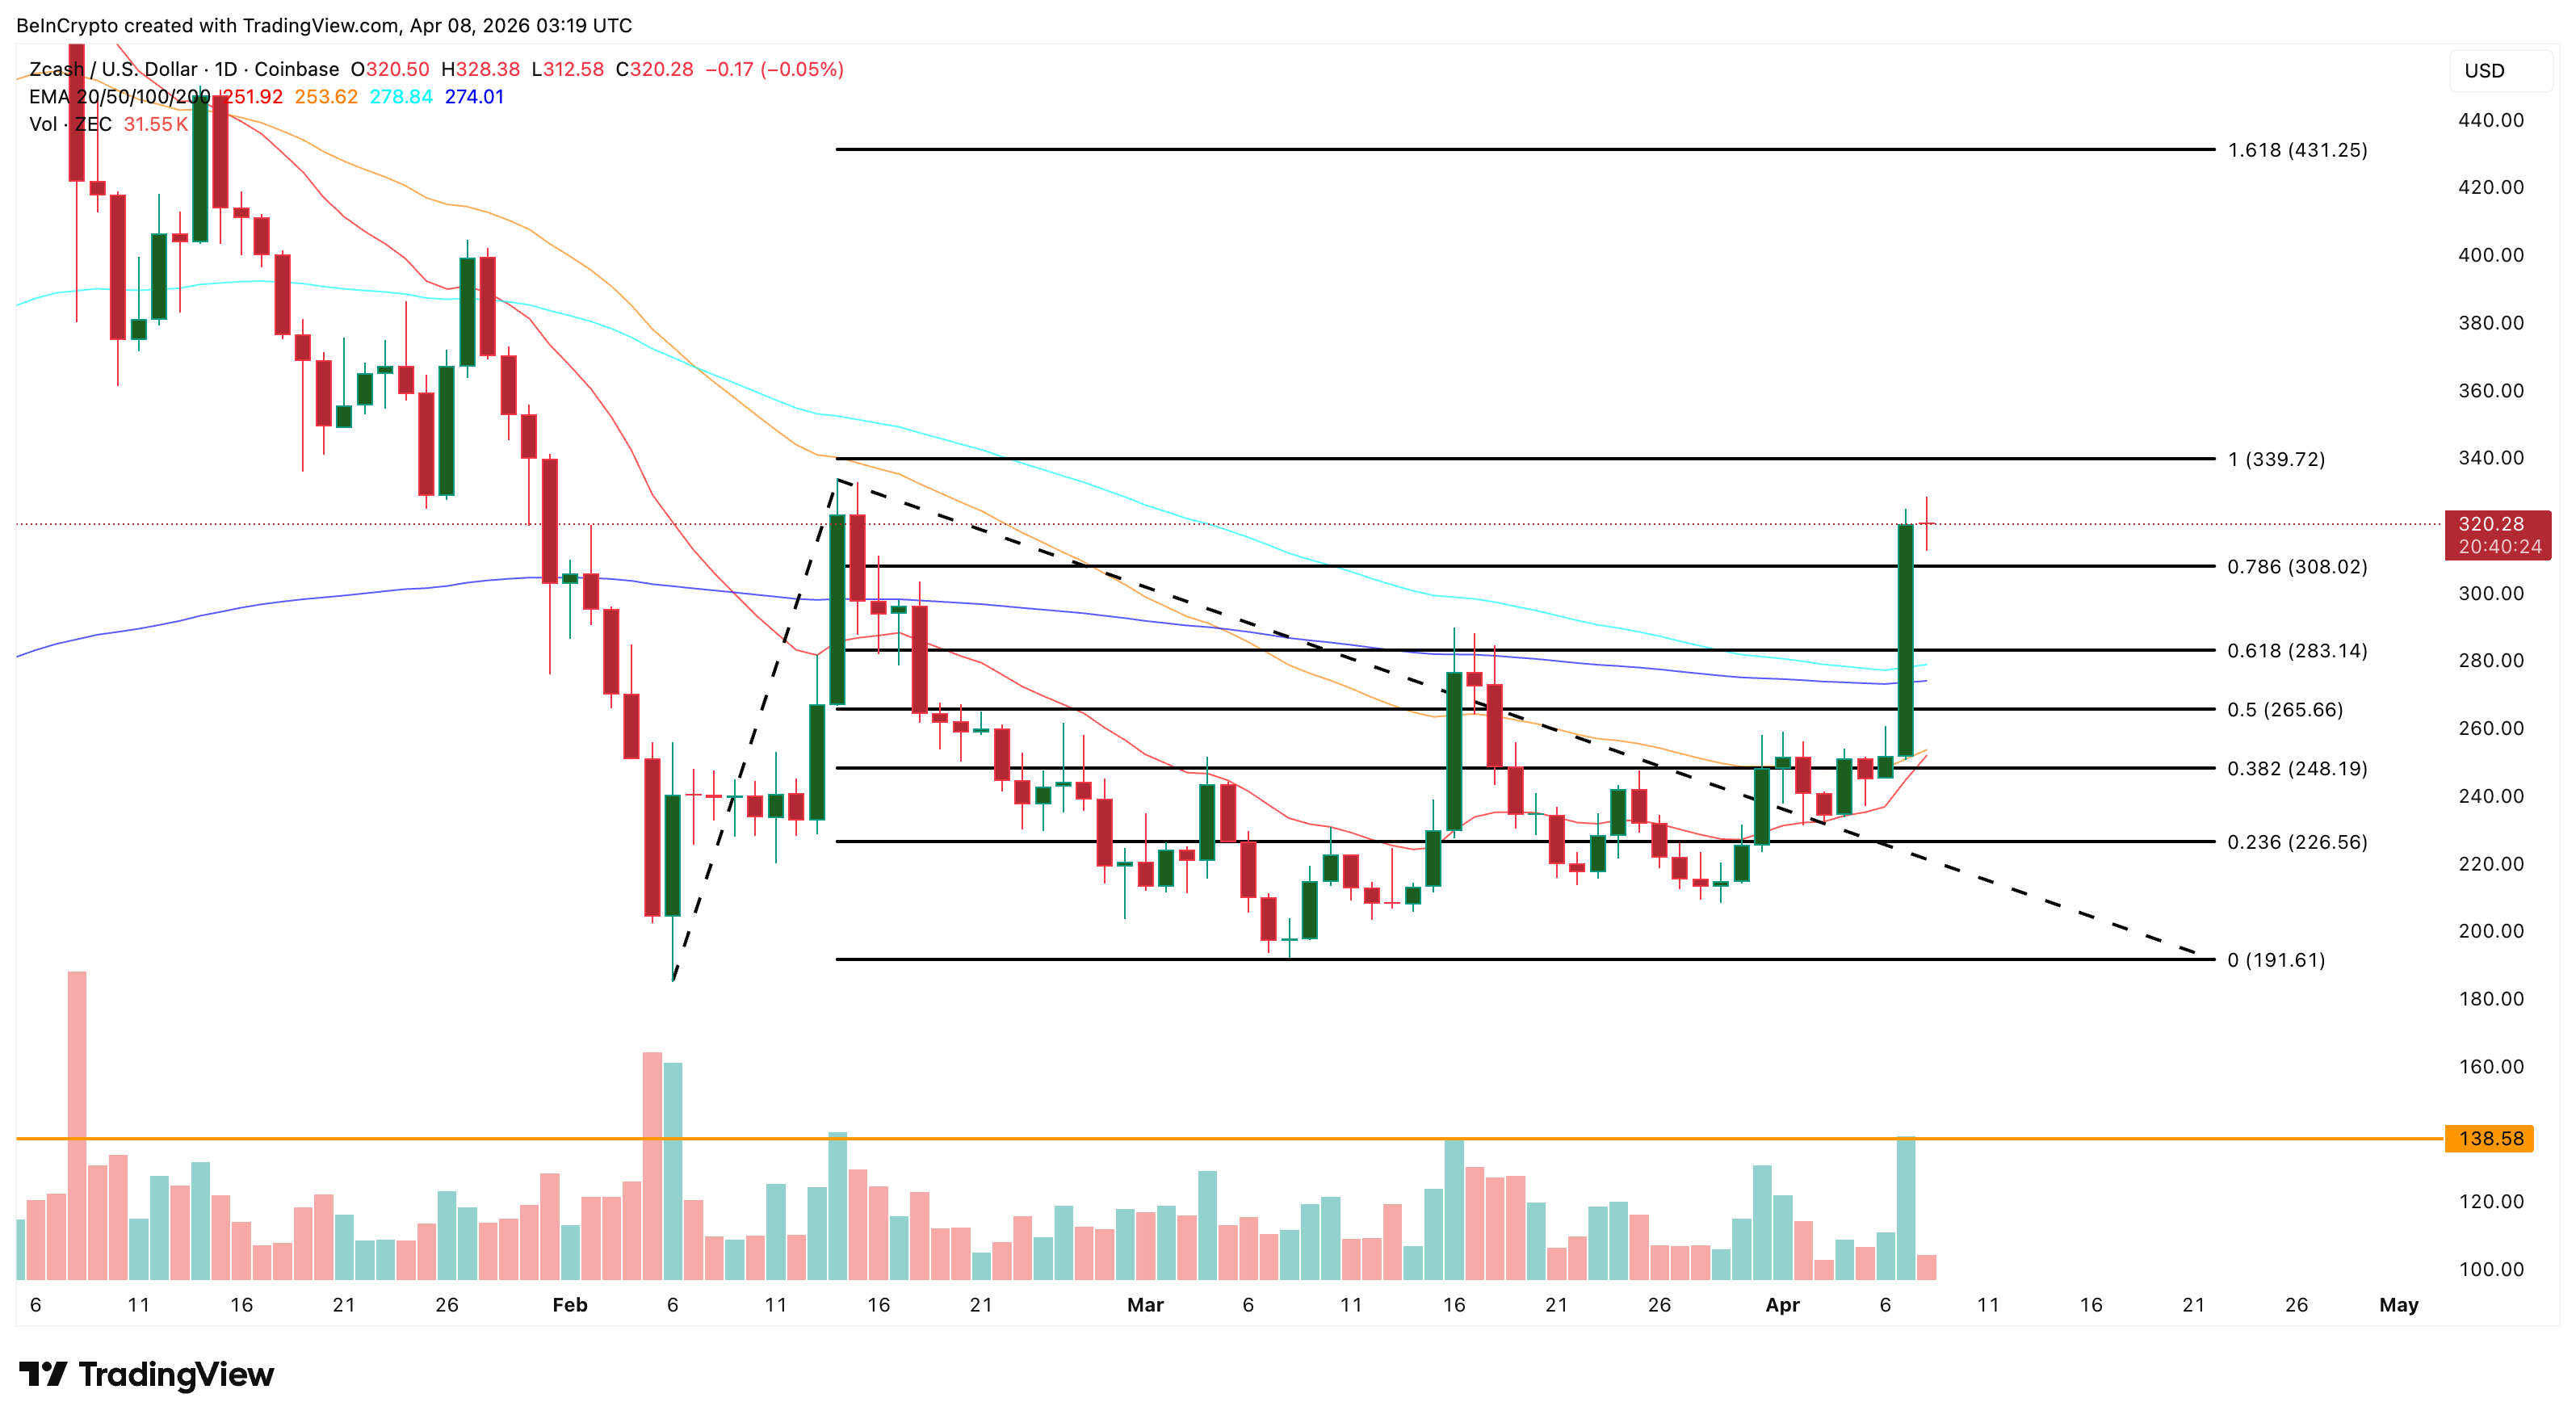
Zcash (ZEC) trades at $320.28 after surging approximately 27% over the past 24 hours. This makes it one of the strongest performers among the top 100 tokens by market cap. The broader ceasefire-driven recovery gave altcoins room to run, and ZEC capitalized with a structural breakout.
The rally began on April 6 when ZEC reclaimed the 50-day EMA with rising volume. That reclaim acted as a trigger. Between April 7 and 8, ZEC crossed the 100-day and 200-day EMAs in rapid succession. ZEC has effectively reclaimed all four major moving averages in two sessions. The volume spike that accompanied the breakout was the highest since mid-March. This confirmed that the move had buyer conviction rather than thin-air momentum.
Of the $596 million in total 24-hour liquidations, ZEC shorts accounted for $13.39 million, adding fuel to the rally as forced covering amplified the buying pressure.
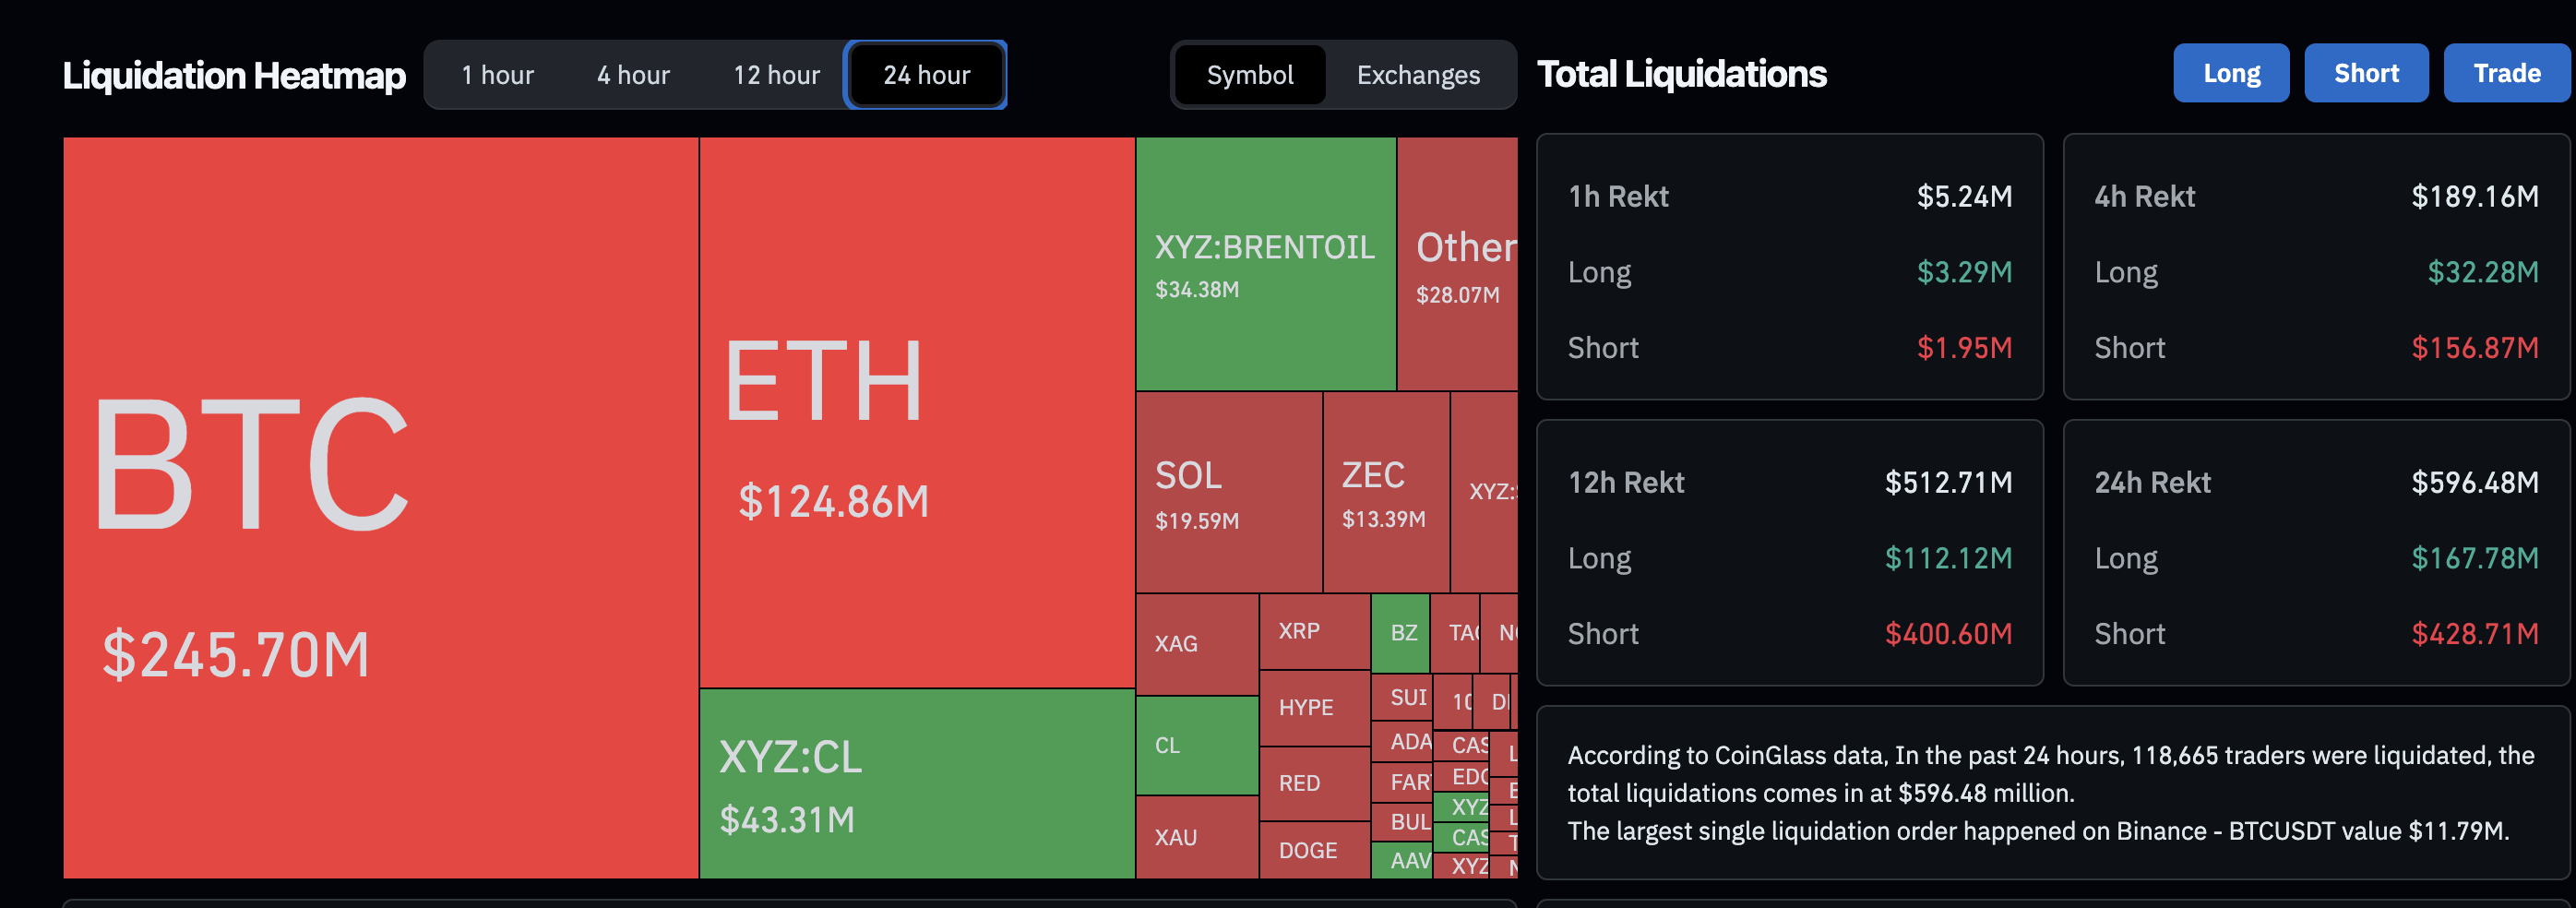 Liquidation Map: Coinglass
The key technical level at $339 is the immediate target. A daily close above that level opens the path toward $431.25. If ZEC fails to hold above $308 at the 0.786 Fibonacci level, the 0.618 level at $283 becomes the strongest support. It also aligns with the clustered EMA zone.
 Zcash Price Analysis: TradingView
For now, $339 separates an extended breakout toward $431 from a retracement back to the $283 support zone.
0
0


 Manage all your crypto, NFT and DeFi from one place
Securely connect the portfolio you’re using to start.

0
0


0
0