BTC Price – Profits Surge 21%, Final Bull Run Just Beginning?

0
0

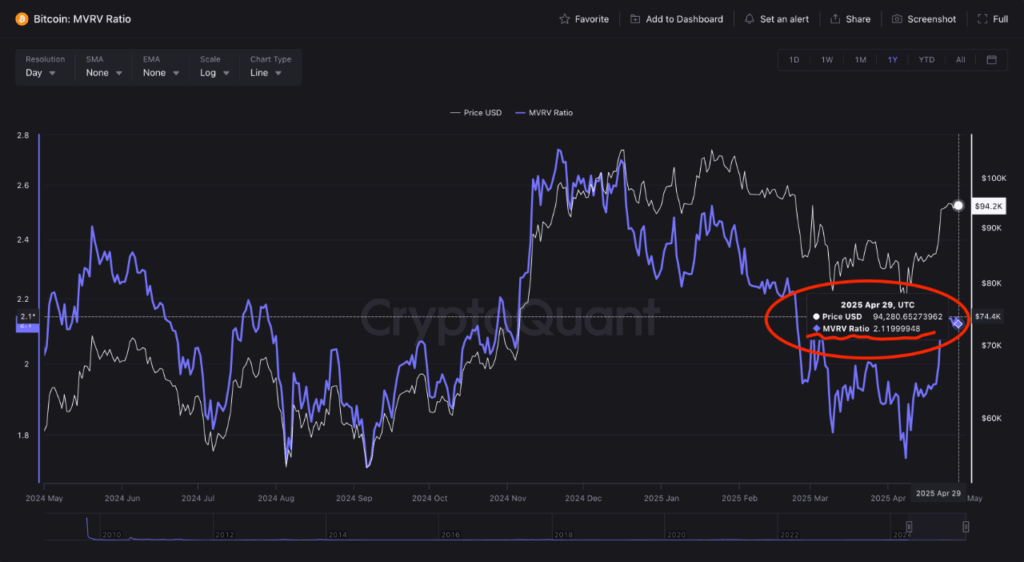
Bitcoin’s (BTC) price activity has shown a sharp shift in investor profitability over the past three weeks. From April 8 – April 29, the MVRV ratio rose 21.84% as it moved from 1.74 to 2.12.
This metric compares Bitcoin’s current market value with the average cost at which holders obtained their coins. This change indicates a higher unrealized profit in the entire network.
As the Bitcoin USD value climbed steadily, more investors moved into profitable positions. This typically causes changes in the market activity, for instance, increase in selling activity from the short-term holders meaning to go for the profits.
The MVRV is increasing, but it is still below the levels from previous bull market peaks. Past cycle tops have corresponded to MVRV values this high, around 3.5 to 4.0. At its current level, the market may still have room to move upward before approaching those past extremes.
Long-Term Holder Activity Drops Back to Normal
In addition to rising profits, data also shows that long-term holders are becoming less active. The 60-day Coin Days Destroyed (CDD) metric, which tracks when older coins are moved, has returned to normal levels after being elevated for most of 2024.
From January through February, older Bitcoin (BTC USD) holdings moved more frequently, suggesting that experienced investors were repositioning or cashing out. However, that trend shifted in March. By March 27, CDD had fallen to one of its lowest readings in months.
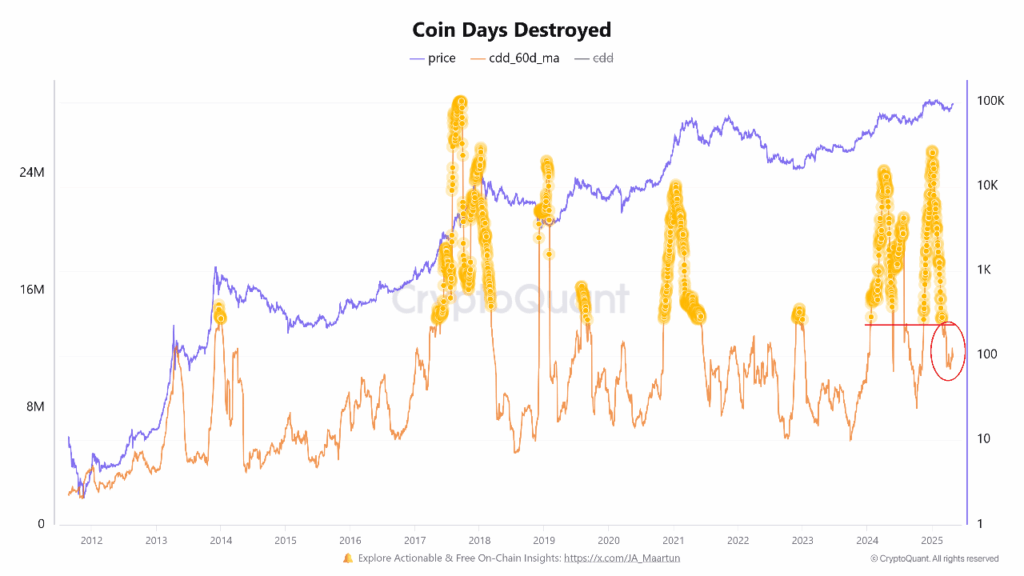
This drop indicates that long-term holders are now less active on the network. Lower movement from this group generally signals less selling pressure and more stability in supply. When coins remain dormant, it may support the Bitcoin (BTC USD) price by reducing available supply in the market.
Periods of low CDD following high activity are sometimes followed by accumulation, which often precedes the next move in market direction.
Short-Term Selling Pressure Persists
Although long-term metrics suggest reduced pressure, short-term trading data signals a possible slowdown. The Buy/Sell Pressure Delta—a tool used to track buyer versus seller strength—has shown elevated values since early March.
This indicator first declined on March 6 and peaked on March 18. Since then, it has remained in a range that in the past has preceded temporary price corrections since then. Generally if readings are above zero, this highlights that buyers ease off and sellers strengthen.
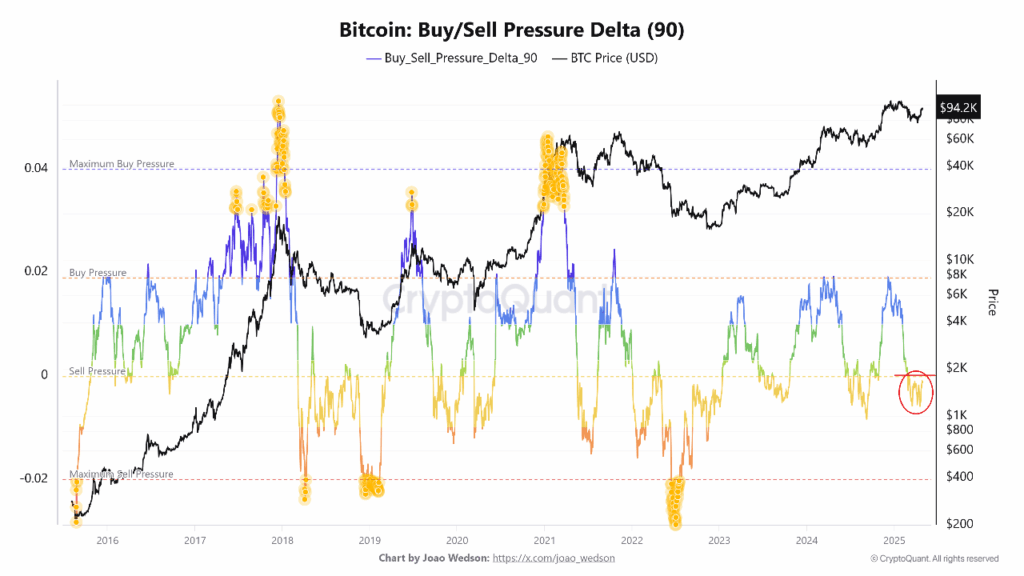
This is not a standalone signal, but it is something many traders watch on for signs of a cooling momentum. Despite favorable long-term conditions the short-term market may still favour sellers per current data.
Monitoring this measure alongside other indicators can help gauge whether the recent Bitcoin price strength will hold or face short-term resistance.
BTC Price Market Outlook Shows Momentum, With Risks Ahead
The overall view of the Bitcoin (BTC USD) market is one of continued growth with signs of possible near-term caution. Recently, an increase in unrealized profits (the MVRV ratio) confirms that many investors are in profitable territory. This usually helps boost market confidence but sometimes some holders take profit near resistance zones.
Lon-term holder behaviour has also calmed too at the same time. However, it seems as though selling from large, dormant wallets have slowed as CDD moves back to normal levels. Increased buying interest may even help to support prices if that shift can match or exceed current supply levels.
On the other hand strong short-term sell signals appear. If buying activity slows further, a pullback in the Bitcoin price is possible. The pattern suggests the market isn’t quite starting a final peak yet, but they still face a challenge in their climb.
Meanwhile, investors can watch for long and short-term indicators to see if this signals the end or merely a brief pause before further gains.
The post BTC Price – Profits Surge 21%, Final Bull Run Just Beginning? appeared first on The Coin Republic.
0
0

 Manage all your crypto, NFT and DeFi from one place
Securely connect the portfolio you’re using to start.


0
0

0
0