Bitcoin (BTC) Selling Pressure is Fading, Hinting Recovery at $90,000

0
0


Bitcoin (BTC) has dropped nearly 5% in the last seven days, struggling to regain momentum while trading below $90,000 for almost a week. The technical outlook remains bearish, with BTC’s EMA lines reinforcing downside pressure and key support at $81,500 at risk of breaking.
However, the DMI chart suggests that selling momentum is fading, and a potential trend reversal could be on the horizon if buyers step in. If BTC reclaims $84,800, it could signal the start of an uptrend, with a possible push toward $92,910 in the coming sessions.
Bitcoin DMI Shows Sellers Are Still In Control, But That Could Change Soon
Bitcoin’s Directional Movement Index (DMI) shows that the Average Directional Index (ADX) has slightly decreased from 31 to 28, indicating a weakening trend strength.
The ADX measures the overall strength of a trend. Values above 25 are generally considered indicative of a strong trend, while values below 20 suggest a weak or directionless market, as some analysts suggest this cycle is different from others and whether BTC has already peaked this cycle or not.
A declining ADX after reaching elevated levels could mean that the current trend—whether bullish or bearish—is losing momentum, opening the possibility of a shift in market direction.
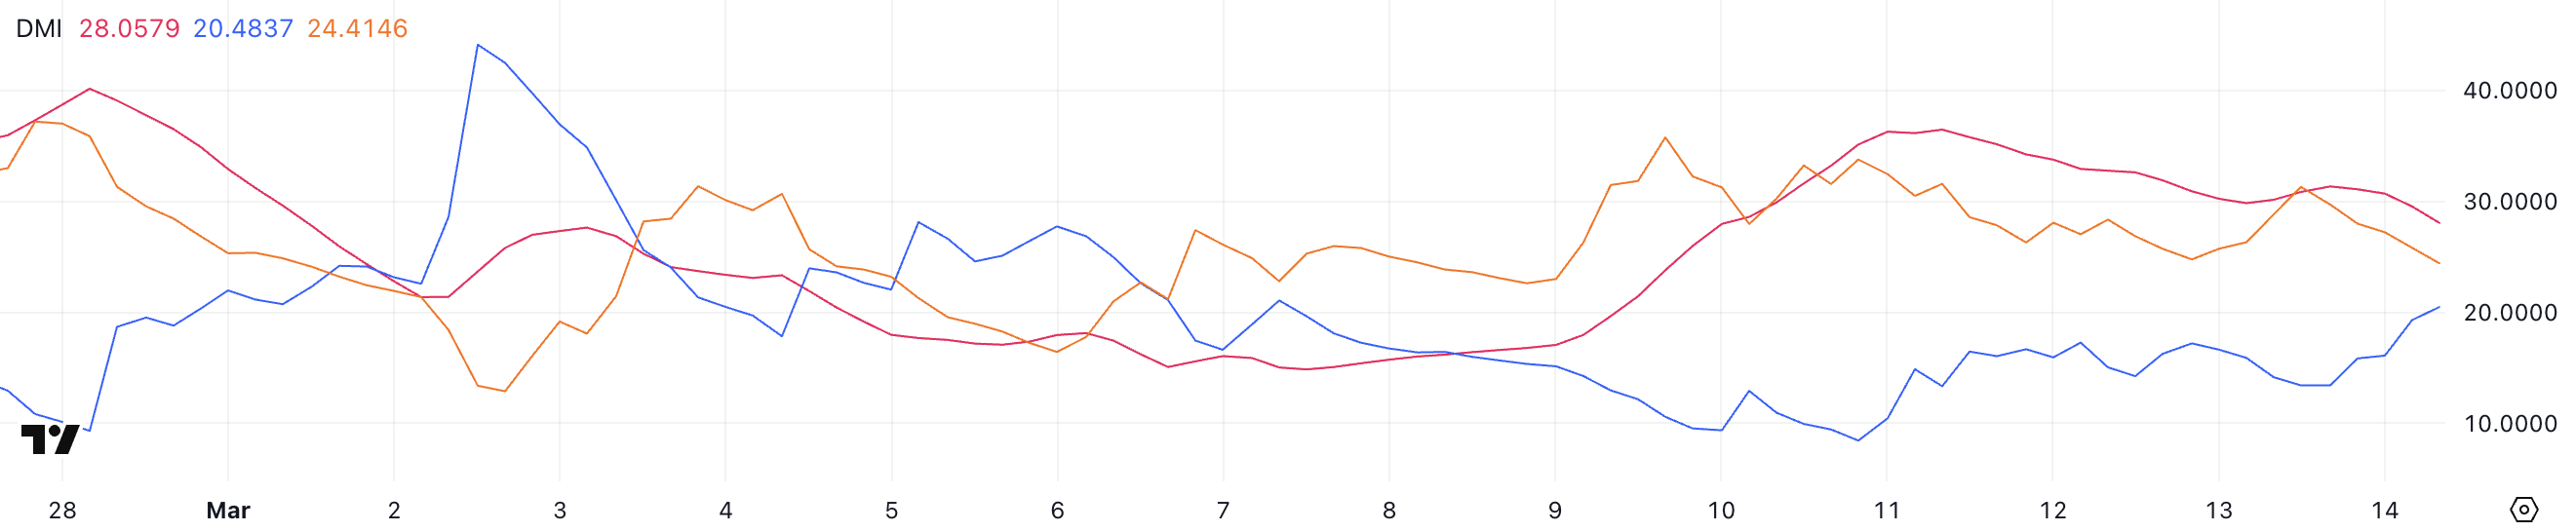 BTC DMI. Source: TradingView.
Meanwhile, the +DI (positive directional index) has risen from 13.4 to 20.48, while the -DI (negative directional index) has dropped from 31.3 to 24.4. This shift suggests that selling pressure is fading while buying momentum is increasing.
Although BTC is still technically in a downtrend, the narrowing gap between the two directional lines and the rising +DI indicate a potential trend reversal. If this trend continues and +DI crosses above -DI, it would confirm a transition into an uptrend, signaling a shift in market sentiment.
However, with ADX still above 25, sellers still hold some control, making the next few sessions crucial in determining whether Bitcoin can fully reverse its downtrend.
BTC Ichimoku Cloud Shows A Mixed Pattern
Bitcoin’s Ichimoku Cloud chart presents a mixed outlook, with the price currently attempting to break above short-term resistance levels.
The Tenkan-sen (blue line) and Kijun-sen (red line) are closely following the price action, indicating a battle between buyers and sellers.
While BTC has managed to push slightly above the Kijun-sen, the Ichimoku Cloud remains red and positioned above the current price, signaling that the broader trend is still bearish.
Until Bitcoin manages to break decisively above the cloud, any upward movement remains fragile, and resistance around $84,000 could be a critical test for bulls.
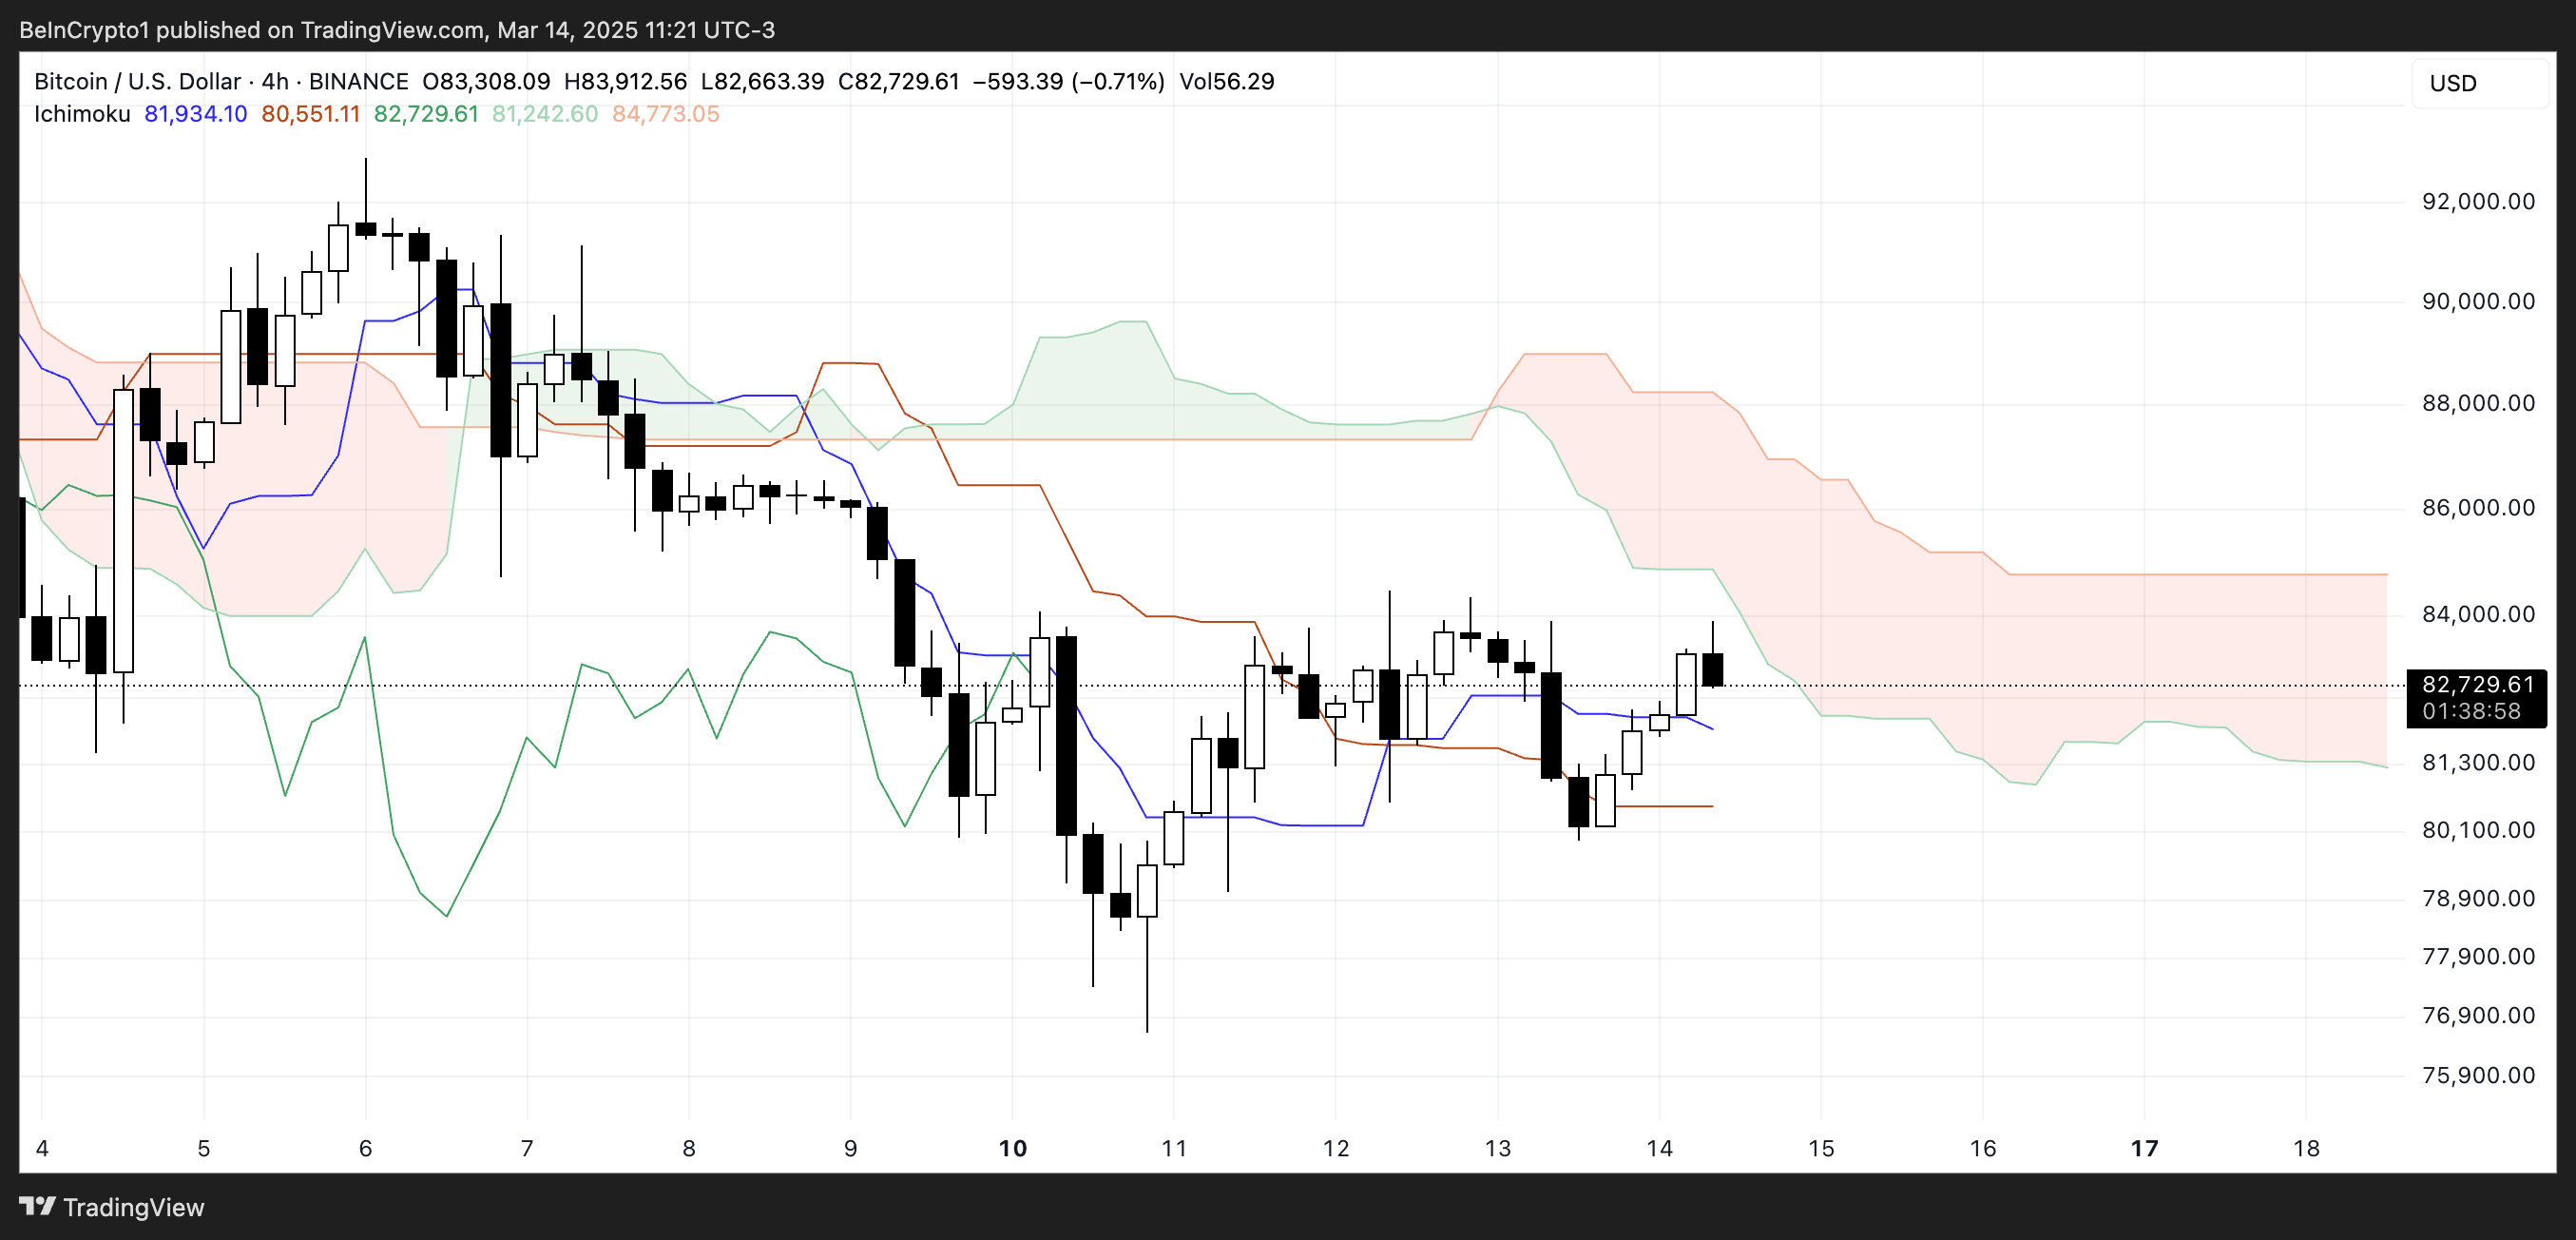 BTC Ichimoku Cloud. Source: TradingView.
Looking forward, BTC needs to sustain a move above the lower boundary of the Ichimoku Cloud to establish a potential trend reversal.
However, the presence of a thick red cloud ahead suggests that sellers still dominate, making further upside movement challenging.
If BTC faces rejection at the cloud, a retracement toward the $81,000 support level is possible. Conversely, a successful break above $84,000 would flip market sentiment more bullish, potentially leading to a rally toward $86,000 and beyond.
Will Bitcoin Keep Above $80,000?
Bitcoin’s EMA lines remain in a bearish alignment, with short-term moving averages positioned below long-term ones, signaling continued downward pressure.
If the current trend persists, Bitcoin price could test the $81,500 support level, a key zone that has been held in recent sessions. A break below this level could trigger additional selling, potentially pushing the price down to $76,635, a level not seen in weeks.
The EMA structure suggests that sellers still have control, and without a clear reversal signal, further downside remains a possibility.
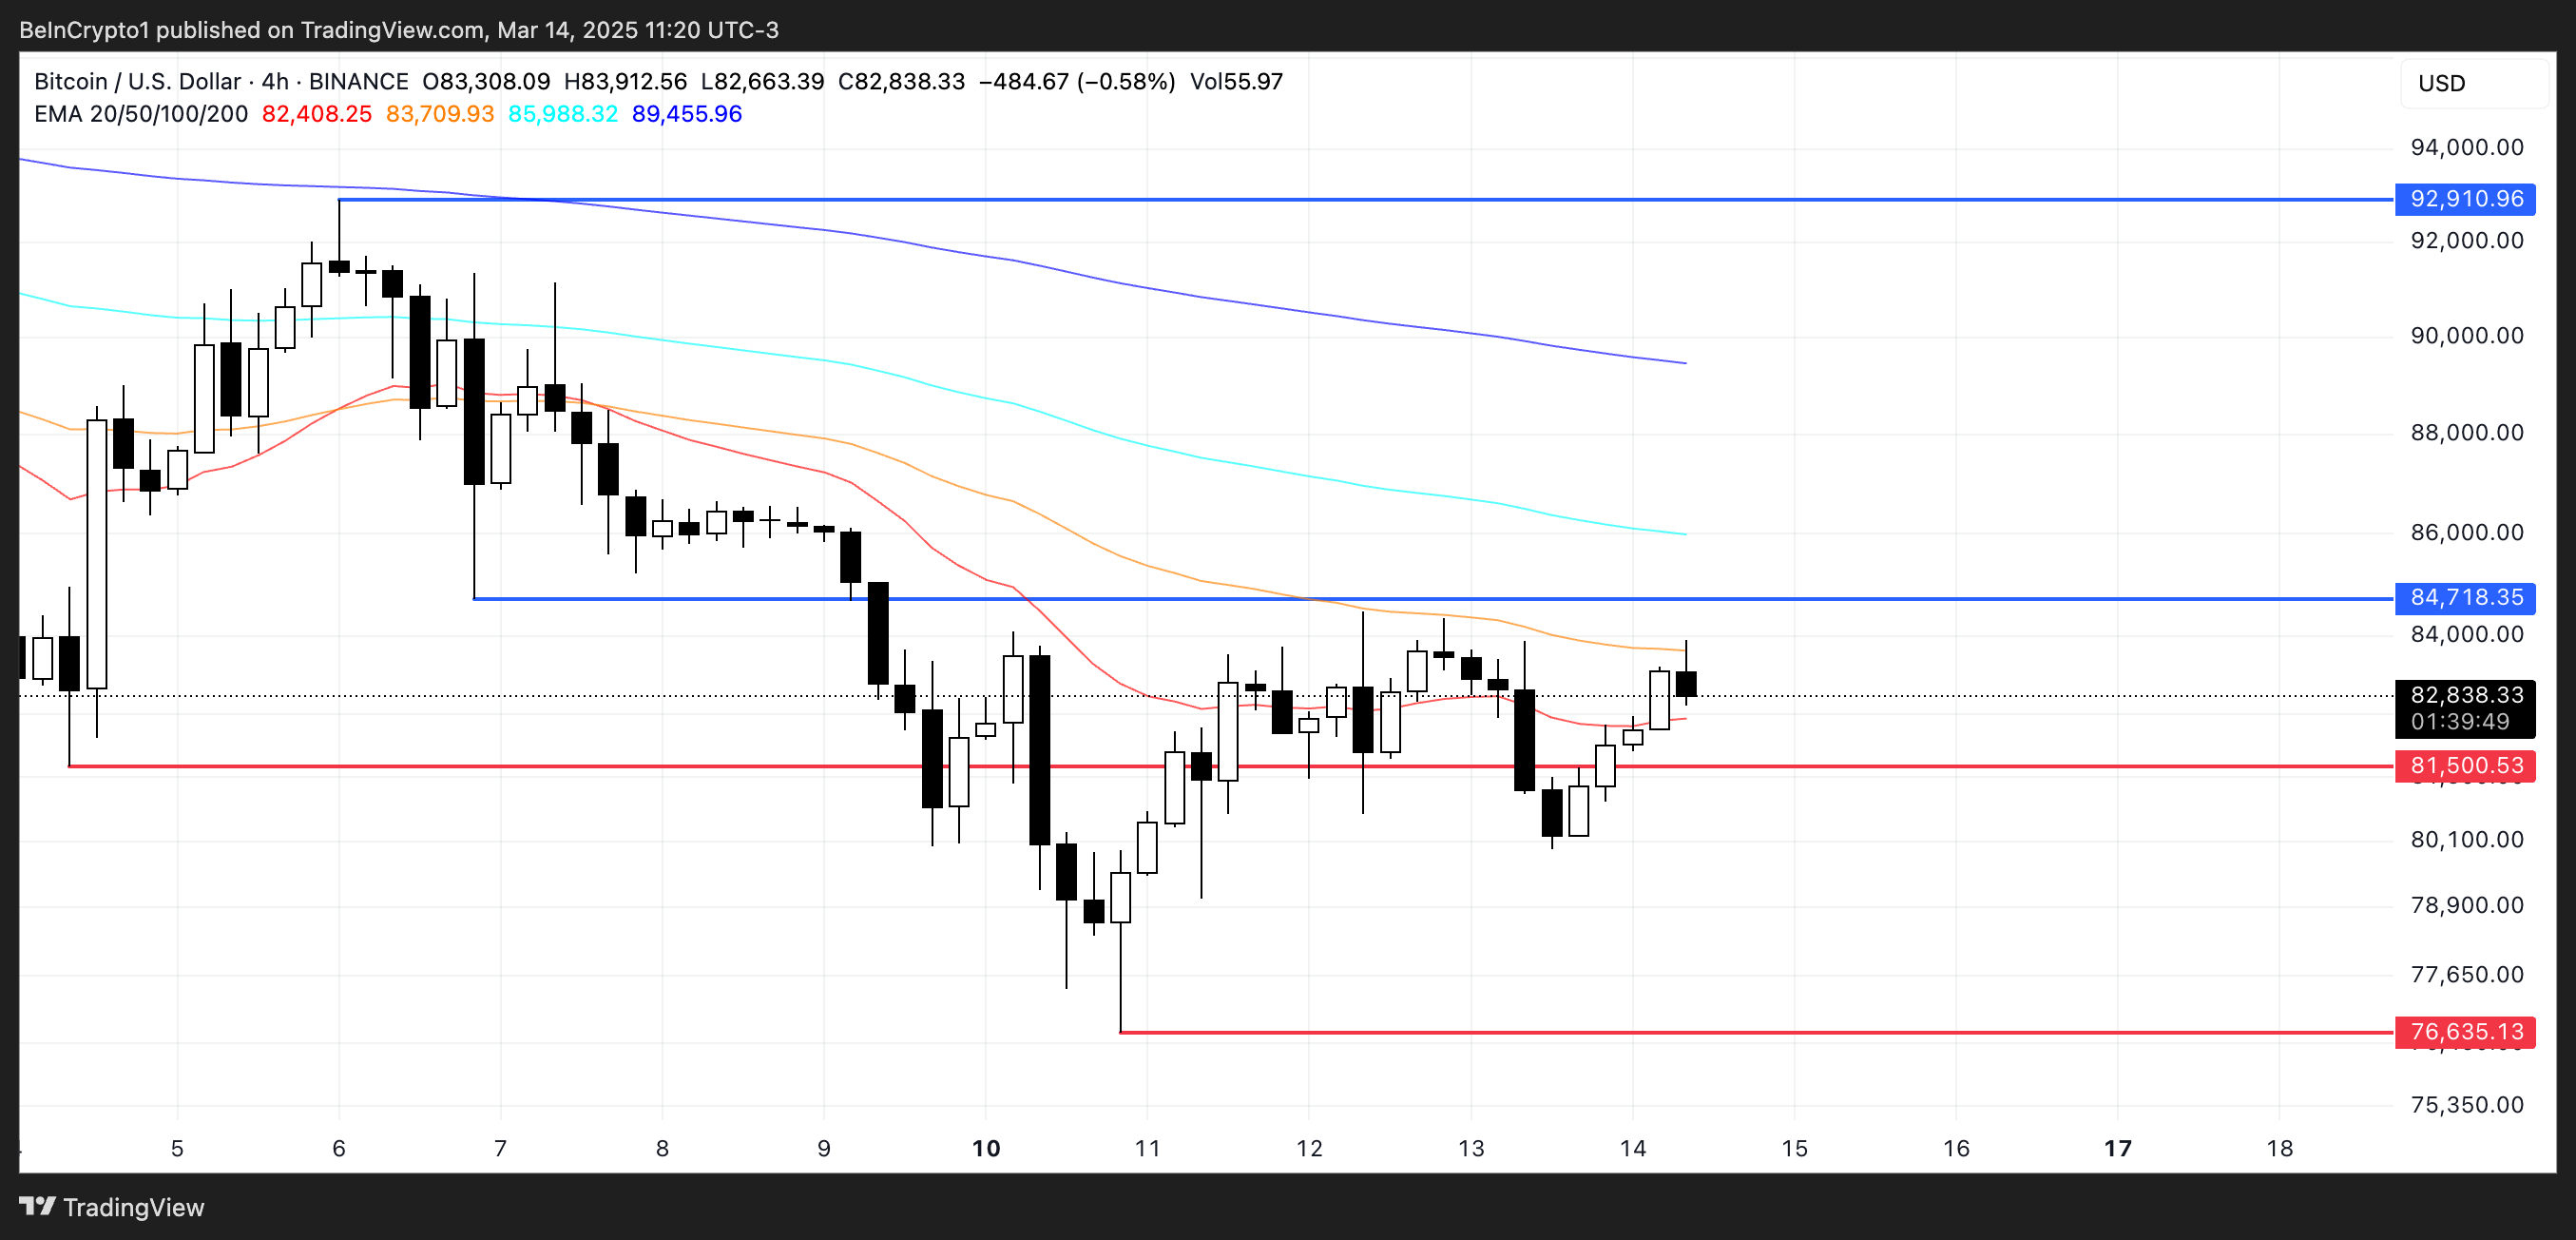 BTC Price Analysis. Source: TradingView.
However, BTC’s DMI chart indicates that a trend shift could be approaching, suggesting that bullish momentum may soon gain traction.
If Bitcoin reverses course, the first key resistance to watch is $84,718, which could act as a major barrier before any sustained upward move.
A successful breakout above this level could confirm a trend shift, opening the path toward $92,910 if the uptrend strengthens.
0
0


 Manage all your crypto, NFT and DeFi from one place
Securely connect the portfolio you’re using to start.


