
Why Are Bitcoin, Ethereum, and XRP Prices Up Today? Fed Bets Rise

0
0

Bitcoin, Ethereum, and XRP prices climb as traders eye Fed decision
Bitcoin, Ethereum, and XRP watchers got some relief today. BTC climbed near $78,000, pulling the wider crypto market up with it.
This comes after Bitcoin fell hard from its August peak near $81,500. Ethereum and XRP followed the same path, trading above $2,400 and $1.36.
Behind the bounce sits one big question. What will the Federal Reserve do at its September 16 meeting?
What are the odds of a Fed rate hike in September 2026?
CME FedWatch data puts the odds of a 25 basis point hike at 60.2%. That would push the federal funds rate from 3.5% to 3.75%, up to a new range of 3.75% to 4%.
A prediction market chart backs this up. It shows 60.2% odds for a hike into the 375 to 400 range, against 39.8% for no change at all.
At the Fed's last meeting in July, policymakers held rates steady. But they flagged that inflation was still running above the 2% target.
Three officials actually pushed for an immediate hike back then. That tells you pressure for tighter policy has been building for a while now.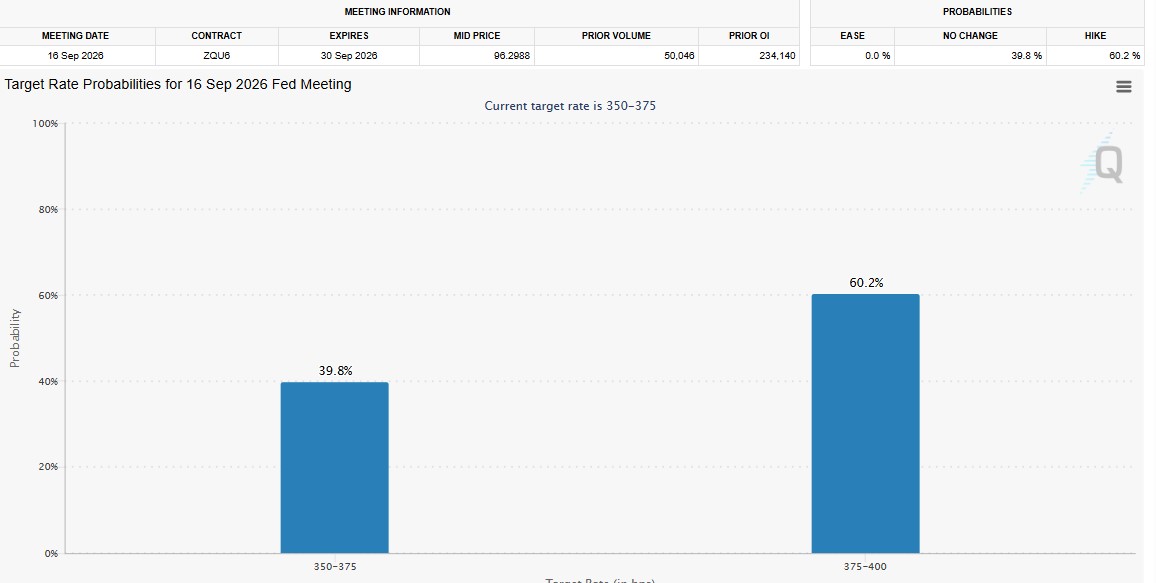
How would a rate hike affect Bitcoin and crypto prices?
Higher rates usually hurt crypto. Here's why.
When rates go up, cash and bonds pay more. That makes risky assets like Bitcoin look less attractive by comparison.
Higher rates can also strengthen the US dollar and tighten liquidity. Leveraged trading gets more expensive too.
Research from the IMF found that Fed tightening has historically weakened crypto prices through what's called the risk-taking channel. Simply put, investors pull back from risk when borrowing costs rise.
XRP and other altcoins could see bigger swings than Bitcoin. They tend to have thinner liquidity, so moves in either direction hit harder.
Still, a hike doesn't guarantee a sell-off. Since most traders already expect this move, some of the impact may already be baked into current prices.
The real story will be in the details. If Fed Chair Kevin Warsh signals no more hikes are coming, markets could shrug it off, or even rally on relief.
A bigger-than-expected hike would be a different story, and could pressure Bitcoin, Ethereum, and XRP harder.
What does the Fear and Greed Index say about crypto sentiment?
Sentiment is leaning positive right now. The Fear and Greed Index rose to 65 on Thursday, just up from 63 the day before.
That puts the market in Greed territory. Steady sentiment like this often helps prices hold their gains, even with Fed uncertainty hanging over the market.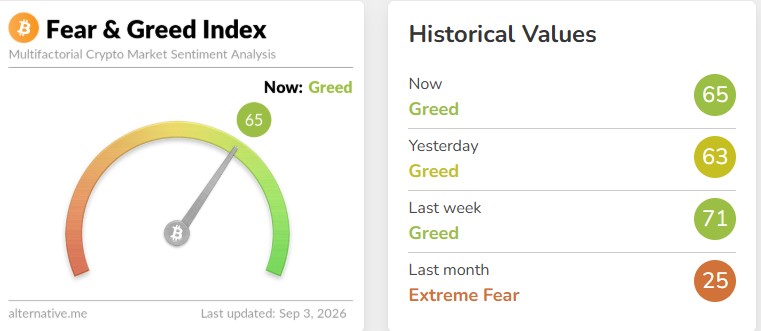
Bitcoin attracts ETF inflows as Ethereum and XRP see outflows?
Bitcoin spot ETFs pulled in $101.15 million on Wednesday. That's a turnaround from Tuesday, when the funds saw $236 million in outflows.
Total cumulative inflows now sit at $54.71 billion, up slightly from $54.61 billion. Assets under management averaged $97.22 billion.
Ethereum ETFs told a different story. They logged $48.08 million in outflows on Wednesday, snapping a 12-day inflow streak. Cumulative inflows stand at $13 billion, with $15 billion in net assets.
XRP ETFs also turned negative, with $7.20 billion in outflows breaking an 11-day winning streak, according to SoSoValue. Cumulative inflows remain at $1.68 billion, with $1.42 billion in net assets.
If outflows continue for Ethereum and XRP, that added supply could weigh on prices. For now, positive sentiment may cushion the blow.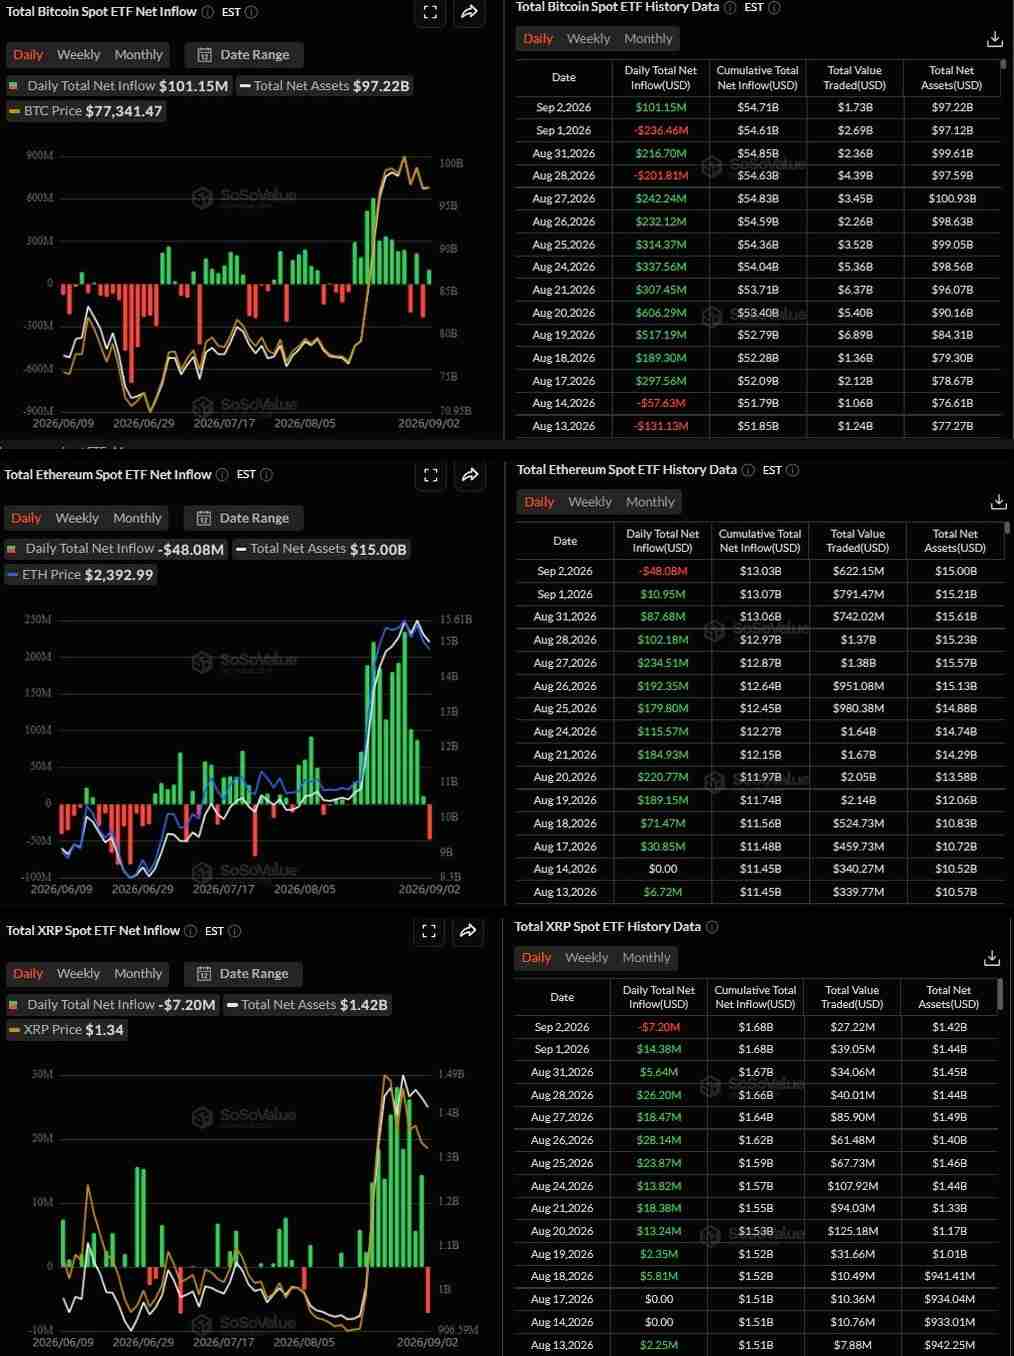
Ethereum price prediction: Is a Wave 4 pullback coming?
Analyst Pepesso laid out an Elliott Wave case for Ethereum. The theory is that ETH just wrapped up Wave 3 after a sharp rally.
That move left what's called a downside imbalance, an area price may need to fill in before moving on. The main Wave 4 target sits between $2,112 and $2,222.
A shallower bounce could happen first, though. The 0.236 Fibonacci level near $2,324 is one spot where buyers may step in early.
If that plays out, the next target zone lands between $2,784 and $2,966. A deeper pullback toward $2,100 could still follow later.
There's a technical reason to expect a flatter Wave 4 instead of a sharp one. Wave 2 in this cycle was quick and steep. Under Elliott Wave alternation, Wave 4 often behaves differently, meaning slower and choppier.
A daily close below $2,050 would break this Wave 4 setup completely.
What are Ethereum's key support and resistance levels today?
On the daily chart, ETH is stuck inside a bullish flag. Price keeps getting rejected near $2,540 to $2,550.
Support has formed around $2,380 to $2,350. Ethereum is holding above its 20, 50, 100, and 200 EMAs, generally a healthy sign for trend strength.
RSI sits near 63, showing solid but not overheated momentum.
A close above $2,550 would open the path to $2,700, then $2,900, with $3,000 becoming realistic if buyers keep pushing.
On the downside, $2,325 is the level to watch. Losing that could send ETH toward $2,170, and possibly $2,060.
Could Ethereum drop to $2,200 this month?
The four-hour chart shows a rounded top pattern, often a sign that momentum is fading after a strong run.
This pattern measures a height of 5.22%. Based on that, ETH could slide toward $2,200 if it breaks below $2,380 support.
The 4-hour RSI near 42 supports this cooling view, well below the daily RSI of 63. That gap shows short-term momentum has weakened faster than the bigger trend.
Analyst Michael Van de Poppe shares a similar take. He sees $2,200 as a plausible dip and a solid entry point for buyers.
His longer-term view stays upbeat. He suggests a drop to $2,200 could actually set up a future run toward $3,000, if traders buy the dip instead of selling into it.
What is Bitcoin's next price target?
On the 4-hour chart, Bitcoin trades inside a descending channel. It's been rejected near $79,500 to $80,000 more than once, with support near $76,000 to $76,500.
RSI near 48 points to neutral momentum, neither overbought nor oversold.
A break below $76,000 could open the door to $75,000, then $74,000. A confirmed close above $80,000 would flip the setup bullish, targeting $81,000 to $82,000.
Some analysts point to Bitcoin's 2023 bottom as a comparison. Back then, price failed three times at channel resistance before a 20% pullback, then broke out on the fourth try.
BTC has already been rejected once this time around. That raises the chance of a dip toward $70,000 before any real breakout.
Bitcoin currently sits near $77,700, caught between whale accumulation and ETF inflows on one side, and cautious sentiment plus Fed uncertainty on the other.
XRP price prediction: What are the key levels to watch?
XRP is compressing near the lower half of a descending channel that formed after its prior 56% rally.
Zone | Price Range | What It Means |
Support | $1.33-$1.35 | Losing this weakens the setup |
Breakout/Reclaim | $1.40-$1.43 | Initial confirmation zone |
First Target | $1.55-$1.60 | Prior resistance area |
Extension | $1.90-$2.00 | Momentum zone |
Main Target | $2.17-$2.19 | Matches projected 56% expansion |
Analyst Ali flagged a separate zone between $1.31 and $1.38, where more than 4.8 billion XRP tokens were accumulated. He says an hourly close above $1.38 could confirm a bullish flag breakout, putting the $2 mark back in focus.
None of these levels are locked in. XRP needs to break and hold above the descending channel, not just wick through it, for the bullish case to gain real confirmation.
Can XRP price hit $2 this month?
A move to $2 is possible, but far from confirmed. It would likely need a clean breakout above $1.43 on strong volume, plus supportive news from Friday's payrolls report, the Fed meeting, or the CLARITY Act vote.
If XRP loses the $1.33 to $1.35 support zone instead, a slide toward $1.27 becomes more likely.
Traders should watch three dates closely: Friday's payrolls data, the September 15 Senate vote, and the September 16 Fed decision. Any one of these could set the tone for XRP through the rest of the month.
Disclaimer
This article is for informational purposes only and does not constitute financial, investment, or trading advice. Cryptocurrency prices are highly volatile, and past performance does not guarantee future results. Always do your own research and consult a licensed financial advisor before making investment decisions. The author and publisher are not responsible for any losses incurred from trading decisions based on this content.
0
0


 Manage all your crypto, NFT and DeFi from one place
Securely connect the portfolio you’re using to start.


