Algorand (ALGO) Trends Sideways After Hitting 30-Day High
4d ago•

bullish:
0
bearish:
0
Share

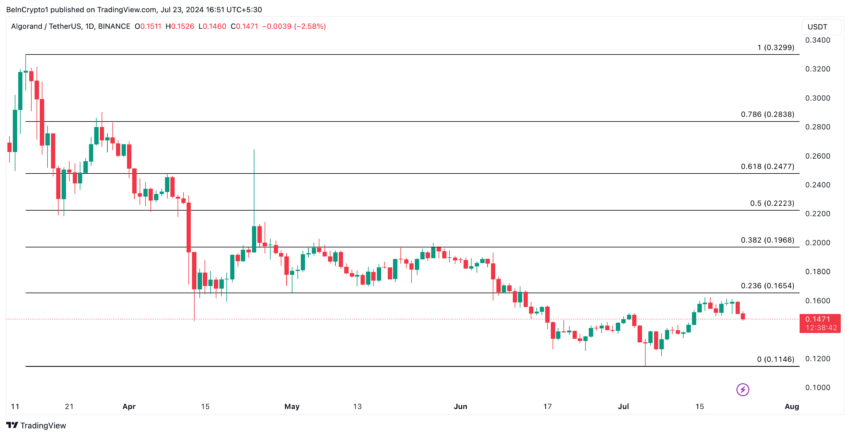
Algorand (ALGO) hit a 30-day high of $0.15 on July 16. However, the altcoin’s price has since consolidated, trading sideways within a narrow range.
ALGO faces resistance at the $0.16 level while finding support at $0.14.
Algorand Trends Within a Range
Algorand has trended within a horizontal channel since it closed at a 30-day high on July 16. This channel is formed when the price of an asset consolidates within a range for a period of time. The upper line of this channel forms resistance, while the lower line forms support.
An asset trends within a range like this when there is a relative balance between buying and selling pressures, preventing its price from trending strongly in either direction.
The tussle between ALGO bulls and bears in the past few days has weakened the market’s pre-existing uptrend. This is evidenced by the fall in the token’s Aroon Up Line. At press time, the indicator remains in a downtrend at 57.14.
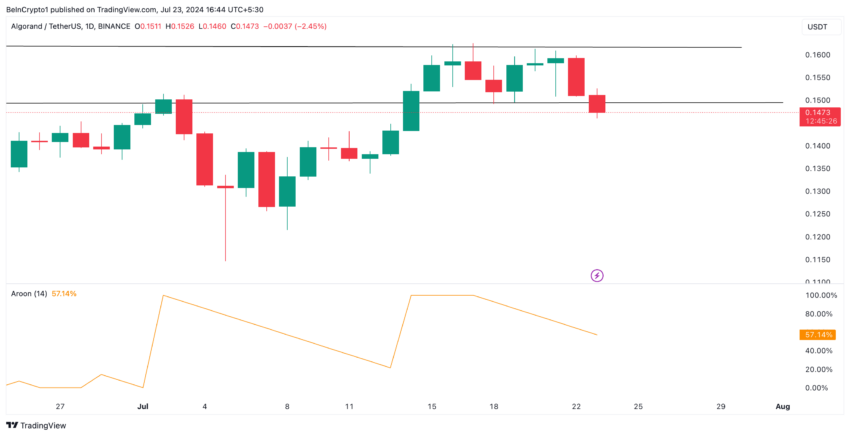 Algorand Price Analysis. Source: TradingView
An asset’s Aroon Indicator tracks its trend strength and identifies potential reversal points. When the Aroon Up line is in a downtrend, it indicates a weakening bullish trend. This trend suggests that an asset is losing its upward momentum and might be transitioning to a downtrend or entering a consolidation phase.
Further, ALGO’s Relative Strength Index (RSI) is also in a downtrend. At press time, it had crossed below the 50-neutral line and was spotted at 48.39.
Read more: What Is Algorand (ALGO)?
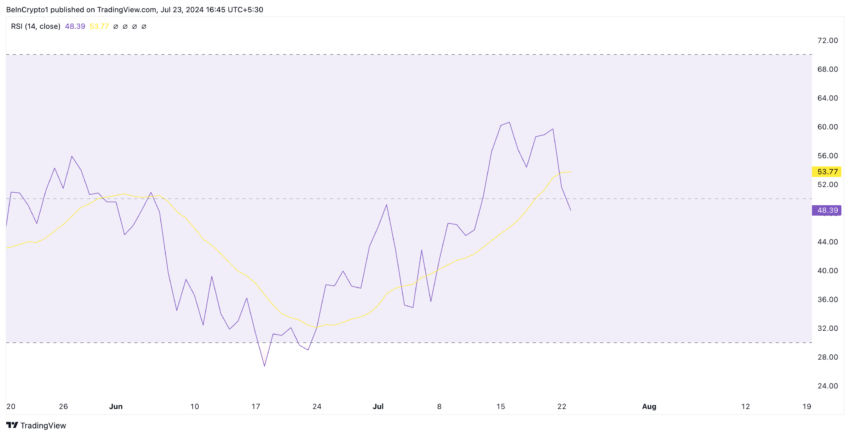 Algorand Price Analysis. Source: TradingView
This indicator measures an asset’s overbought or oversold market conditions. It ranges between 0 and 100, with values above 70 suggesting that the asset is overbought and due for a decline. In contrast, values under 30 indicate that the asset is oversold and may witness a rebound.
In a downtrend at 48.88, ALGO’s RSI suggests that selling pressure is beginning to outweigh buying activity.
ALGO Price Prediction: Futures Traders Remain Resilient
Despite ALGO’s sideways price movements in the past few days, activity in its derivatives market has not slowed. In fact, its futures open interest has climbed by 7% since July 18.
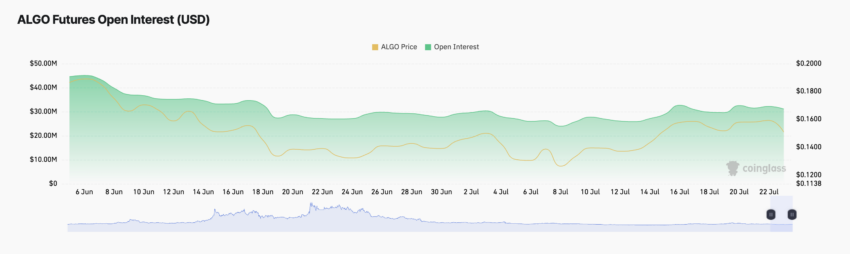 Algorand Futures Open Interest. Source: Coinglass
An asset’s futures open interest refers to the total number of outstanding futures contracts that have not been settled. When it spikes, it means that more traders are entering into new positions.
These new traders entering the ALGO market have opened positions in favor of a price rally. According to Coinglass data, the token’s funding rate has remained predominantly positive since July 9. As of this writing, it is 0.0099%.
Read more: Algorand (ALGO) Price Prediction 2024/2025/2030
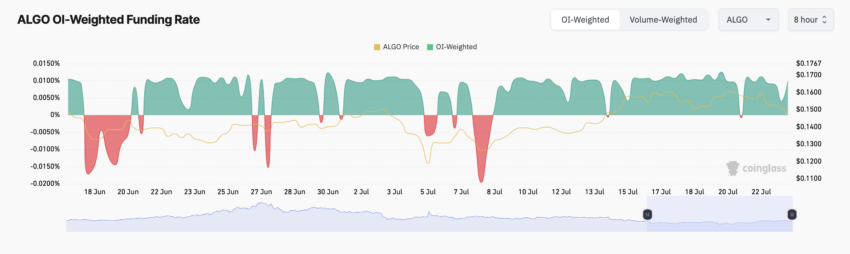 Algorand Funding Rate. Source: Coinglass
When an asset’s funding rate is positive, it means more traders are buying the asset in anticipation of a price rally than those buying and hoping for a decline.
This is a bullish trend and often a precursor to a price rally. If this holds true for ALGO, its price may rise to $0.16.
 Algorand Price Analysis. Source: TradingView
However, if selling pressure gains, the token’s price may fall to $0.11.
4d ago•
bullish:
0
bearish:
0
Share


 Manage all your crypto, NFT and DeFi from one place
Securely connect the portfolio you’re using to start.

bullish:
0
bearish:
0


bullish:
3
bearish:
0