The XRP TD Sequential indicator on the 2-week timeframe has been accurate for three years, and data suggests it now sends bearish signals.XRP has had a turbulent month in February after posting remarkable gains from November 2024 to January 2025. Notably, within this period, the asset enjoyed an impressive 336% increase, reclaiming the psychologically important levels at $1, $2 and $3 along the way.
However, with a 26.67% drop this month, February 2025, XRP has relinquished some of the recent gains. The asset has so far forfeited the $3 price mark, but the bulls are now mounting a potent defense, effectively looking to hedge against a crash below $2.
TD Sequential Points to More Downside
Some analysts have insisted that there is no cause for concern as long as XRP holds $2. Nonetheless, the latest analysis from market watcher Ali Martinez suggests that the XRP correction might not yet be over.
Taking to X, the market commentator called attention to the TD Sequential indicator, a reliable analytical tool. For the uninitiated, The TD Sequential is a technical indicator that detects potential trend reversals by analyzing price bar sequences to signal overbought or oversold conditions.
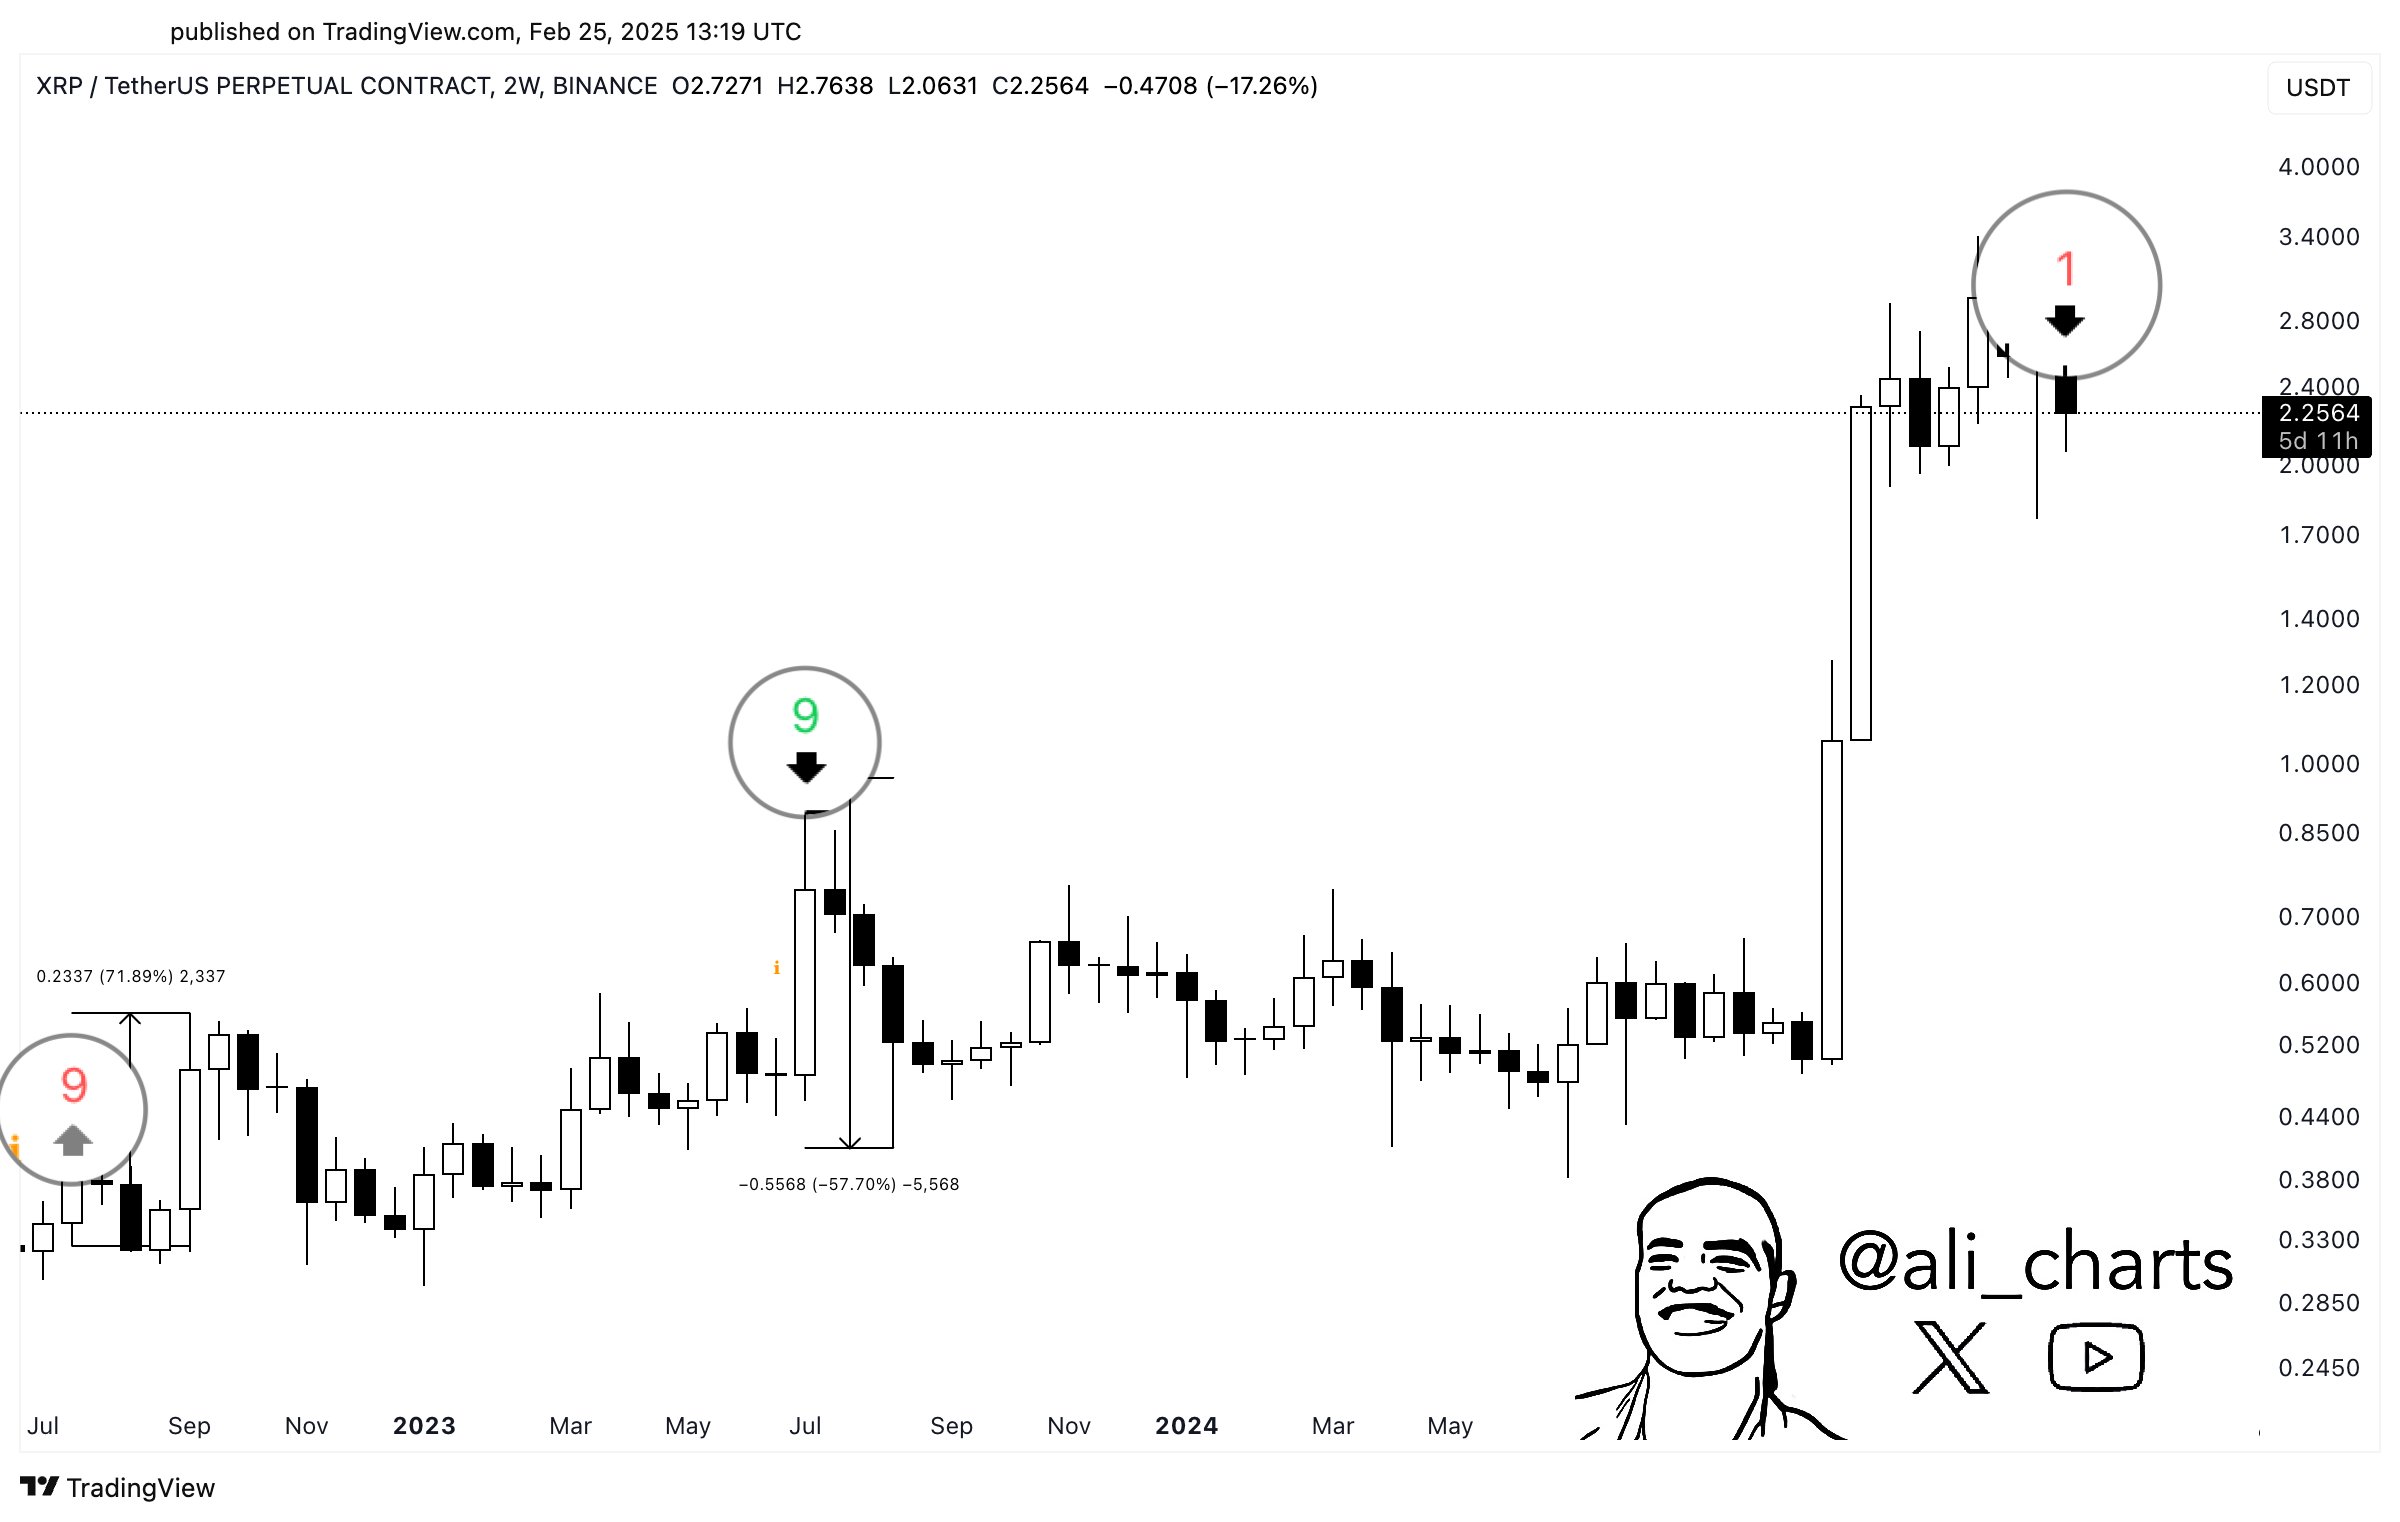
According to Ali Martinez, this indicator has been accurate for XRP in the 2-week timeframe since 2022. Particularly, in mid-2022, after the market downtrend from the Terra implosion, the TD Sequential flashed a buy signal for XRP. Shortly after this signal, XRP surged to a peak of $0.5582 in September 2022, marking a 71.89% increase.
Meanwhile, in July 2023, after XRP's run to $0.93 on the back of the summary judgment in the Ripple v. SEC case, the indicator flashed a sell signal. In response, XRP collapsed in the weeks that followed, dropping 57% to a low of $0.43 by August 2023.
XRP 2W TD Sequential | Ali Charts
Now, the TD Sequential has again displayed a sell signal. The use of 1 indicates the start of a new bearish Setup phase. This suggests that the downtrend may continue, as the indicator has begun counting a new sequence of qualifying price bars in the same direction.
XRP Long-Term Outlook Still Bullish
As a result, XRP investors might not see a relief just yet, especially if Bitcoin continues to consolidate or drop to new lows this year. Earlier today, The Crypto Basicconfirmed that whales had already begun offloading some of their holdings. For context, over the past five days, some whales have dumped $851 million worth of tokens.
Also, Martinez noted in a previous analysis that XRP would need to hold above the $2.27 support for a chance at recovering $3 in the short term. The asset has given up this support so far. Despite the impending short-term drop signaled by the TD Sequential indicator, Martinez believes XRP could hit higher levels in the long term.
Last month, he suggested that XRP may be on the verge of surging to a $15 mark, representing a 584% increase from current levels. He cited a breakout from a 7-year symmetrical triangle. Despite currently trading for $2.22 with a 0.78% 24-hour drop, XRP is still respecting the breakout.


 Manage all your crypto, NFT and DeFi from one place


