Whale Deposits $14M SOL to Binance, Price Dip Ahead?

0
0
Coinspeaker
Whale Deposits $14M SOL to Binance, Price Dip Ahead?
Solana SOL $140.4 24h volatility: 1.0% Market cap: $72.62 B Vol. 24h: $4.47 B has rebounded to trade around $140 after briefly plunging to $97 earlier this month. However, on-chain data suggests that several investors are booking their profits amid this recovery.
On April 22, LookOnChain noted that a SOL whale, who had staked nearly a million SOL at $27 four years ago, has now unstaked 100,000 tokens, worth $13.9 million, and deposited them to Binance. This transfer signals a clear intent to realize profits or potentially hedge against downside volatility.
After 4 years of staking, this whale unstaked 100K $SOL($13.9M) 2 hours ago and deposited it to #Binance.
Back then, he staked 991,079 $SOL at around $27.
He still has 1.19M $SOL($166.37M) staked, with total profits of over $153M.https://t.co/X9KSXT0jES pic.twitter.com/qJ4tehUEUO
— Lookonchain (@lookonchain) April 22, 2025
Despite the large withdrawal, the whale still holds over 1.19 million SOL staked, with estimated unrealized gains of $153 million.
Meanwhile, the number of wallets holding SOL has dipped from 11.11 million to 10.83 million since April 17, suggesting retail interest may be thinning.
A Strong Reversal Setup
Solana’s price has jumped nearly 40% since briefly dipping below the weekly EMA200. It now trades in the local supply zone between $130 and $145, an important region that has historically acted as both resistance and support.
It is interesting to note that SOL appears to be forming an inverse head and shoulders (IH&S) pattern on the daily chart since March, usually a strong reversal setup. The current level is sitting right at the neckline resistance.
Analysts at CryptoVIPSignal on X suggest a potential pullback toward the $114–$120 support area for consolidation before a breakout attempt. Investors might consider accumulation near this zone.
$SOL Analysis:
The #price is forming an Inverse Head & Shoulders (IH&S) pattern on the daily time frame. There is a high likelihood that we will see a move towards the support area for further #accumulation. Currently, the price is at the resistance area. Consider adding some… pic.twitter.com/N4BOE0Czxx
— Crypto VIP Signal™ (@CryptoVIPsignal) April 22, 2025
SOL Price Outlook
On the daily SOL price chart, the RSI currently sits just under 60 with an upward gradient. This suggests that bullish momentum is gaining traction without yet tipping into overbought territory.

SOL price chart | Source: Trading View
Bollinger Bands are widening, with the price near the upper band. A breakout from this consolidation zone may lead to a swift move toward the $158–$162 resistance. This level aligns with the 1D EMA200 and has historically triggered reversals.
Meanwhile, a steady climb in the MACD histogram, along with a bullish crossover also hints at sustained upward momentum.
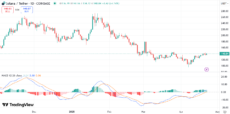
SOL price chart | Source: Trading View
However, any renewed weakness in the overall crypto market could cause SOL to revisit the $95 support. A break below that could lead SOL to 0.786 Fibonacci level at $70. Popular crypto analyst Sri Phoenix recently predicted a SOL drop to $80 in the near-term.
$SOL is going to $80.
Bookmark this. pic.twitter.com/WsIRhRnCsO
— Sri (@sri_phoenix) April 21, 2025
0
0

 Manage all your crypto, NFT and DeFi from one place
Securely connect the portfolio you’re using to start.


0
0