
Hyperliquid Price Prediction: $11.88M Whale Buy Fuels HYPE Rally Talk

0
0

Hyperliquid price prediction talk just got a fresh twist after one wallet made headlines on the network again.
A single address has been quietly building one of the loudest accumulation stories around, and the timing of this latest buy has traders paying close attention.
Add in a chart that has been holding its ground through repeated pressure tests, and there is a lot to unpack here. Here is the full picture.
HYPE Price Today: Live Price and 24-Hour Change
$HYPE is changing hands around 82.594 dollars, down 1.7028 dollars, or 2.02 percent on the day, according to CoinGlass data.
The token carries a market capitalization of 20.83 billion dollars against a circulating supply of 251.65 million HYPE out of a total and max supply of 952.03 million.
Futures volume over the past 24 hours sits at 3.13 billion dollars, spot volume is at 248.93 million dollars, and open interest across derivatives desks stands at 3.30 billion dollars, showing traders are still very active around.
This Hyperliquid price prediction window even as the token cools off slightly from its recent highs.
Source: CoinGlass, September 2, 2026.
HYPE News Today: Whale Accumulation on Hyperliquid
The wallet tagged 0x6436 has once again added to its position, picking up another 141,442 HYPE tokens worth 11.88 million dollars.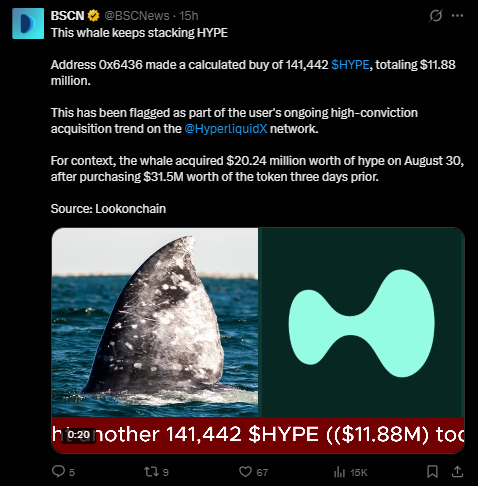
This purchase has been flagged as part of the same wallet's ongoing high conviction buying trend on the Hyperliquid network, a pattern that has held analysts' attention for weeks now.
For context, this same address bought 20.24 million dollars' worth of $HYPE on August 30, and that followed a 31.5 million dollar purchase just three days before that.
Three large buys in quick succession from one wallet is not something the market tends to ignore, and it adds a fresh layer of interest to this HYPE forecast as traders try to work out whether this is smart money getting ahead of a bigger move.
Source: BSCN via Lookonchain, X, September 2, 2026.
HYPE Quick Take: Key Levels and Buy Signal Today
CMP: 82.859 dollars (1-hour chart, Binance perpetual)
Hourly close trigger to watch: above 86.823
Hourly close failure to watch: below 78.559
Data timestamp: September 2, 2026
Risk note: momentum can flip fast around whale-driven tokens, so avoid chasing either side of the move without a plan
HYPE Technical Analysis and Price Forecast
Zooming into the hourly Binance chart, HYPE has been taking support from an ascending trendline and using it to climb steadily.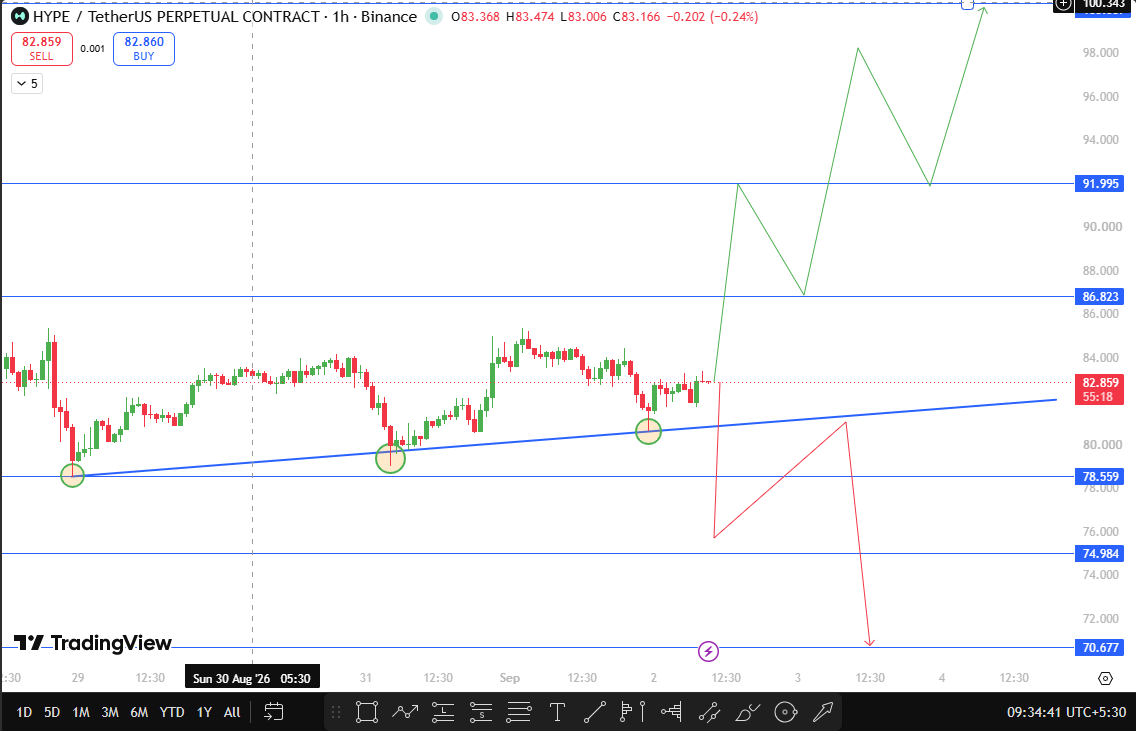
The first retest of that trendline did not just hold; it pushed the price to a new high, which is usually a sign that buyers are still firmly in control rather than just defending old ground.
The second retest was even more telling. Instead of a weak, hesitant bounce, the price snapped back sharply, and that kind of reaction on a repeat test tends to matter more than the first one because it shows the level is being respected under real pressure.
For readers checking this HYPE price target for the first time, here is how the setup breaks down from here.
If the price manages a close above 86.823 on the hourly chart, that opens the path toward 91.995 next, and beyond that, 100.307 comes into play as the next major zone to watch.
On the other side, if HYPE closes below 78.559, that would count as a trendline breakdown rather than a normal pullback, and the next support zone to watch would be 74.984, with 70.677 as the deeper level below that.
Given the trendline is still intact and the second retest bounce came in strong, the setup currently favors buyers holding above 78.559, but a close beyond either boundary would meaningfully change the picture for this HYPE breakout prediction.
Chart source: TradingView, HYPE/USDT Perpetual, Binance, 1 hour, September 2, 2026.
HYPE Support and Resistance Levels Today
Level Type | Price | Change from CMP (82.859) |
Resistance 3 | 100.307 | +21.06% |
Resistance 2 | 91.995 | +11.03% |
Resistance 1 | 86.823 | +4.79% |
CMP | 82.859 | — |
Support 1 | 78.559 | -5.19% |
Support 2 | 74.984 | -9.50% |
Support 3 | 70.677 | -14.70% |
Hyperliquid Price Prediction Scenarios: Bull, Base and Bear Cases
Bull Case: A clean hourly close above 86.823 keeps the ascending structure alive and puts 91.995 in reach fairly quickly, with 100.307 becoming the stretch target if buying pressure stays consistent, especially with a whale wallet still actively accumulating in the background.
Base Case: $HYPE continues to oscillate between 78.559 and 86.823 for now, using the ascending trendline as a floor while it builds enough momentum for a decisive move in either direction. This is the most likely near-term outcome unless a fresh catalyst forces the issue.
Bear Case: A close below 78.559 would flip the structure and confirm a trendline breakdown, sending price down toward 74.984 first and potentially 70.677 if selling pressure follows through, which would undercut this HYPE price outlook in the near term.
Risks to Watch in This Hyperliquid Price Prediction
Whale wallets can accumulate for reasons unrelated to short-term price direction, including over-the-counter deals, exchange rebalancing, or long-term positioning that has nothing to do with the next few candles, so this news should not be read as a guaranteed signal on its own.
Leverage across the derivatives market remains elevated given the current open interest, and that raises the odds of sharp wicks in either direction around the 86.823 and 78.559 levels.
Broader crypto market sentiment, Bitcoin's own trend, and any sudden liquidity shifts on Hyperliquid itself could all override the technical picture described in this HYPE technical analysis.
Key Terms to Understand Hyperliquid Price Prediction
Ascending Trendline: A rising line connecting a series of higher lows, often used to identify dynamic support during an uptrend.
Retest: A move back to a previously broken or tested level to check whether it still holds as support or resistance.
Open Interest: The total value of outstanding derivative contracts that have not yet been settled, used as a gauge of market activity and leverage.
Trendline Breakdown: A close below an ascending trendline that suggests the prior uptrend structure has failed.
Disclaimer
This article is for informational purposes only and should not be treated as financial or investment advice. Cryptocurrency markets are highly volatile, and prices can move sharply in either direction without warning. Readers should conduct their own research and consult a qualified financial advisor before making any investment decisions.
0
0

 Manage all your crypto, NFT and DeFi from one place
Securely connect the portfolio you’re using to start.


