
Orchid Price Prediction: Can OXT Hold This Breakout Move?

0
0

Orchid Price Prediction: Can OXT Hold This Breakout Move?
Something woke this token up. A small privacy coin that most traders had stopped watching just printed one of its sharpest weekly candles yet. Early buyers are sitting on big gains. Everyone else wants to know if there's still time to get in.
Orchid price prediction models are being watched closely this week after OXT posted a violent rally that caught much of the market off guard. Traders want to know if this is a real trend or a short-lived spike.
The rally did not come out of nowhere. Volume spiked hard alongside price, usually a sign of real buying rather than a thin pump. But this is still a small-cap token, and small caps swing hard in both directions.
Is this the start of a real trend reversal or a fast fade waiting to happen?
Key Takeaways
Direction: OXT is in a short-term uptrend after a sharp breakout, but trading inside a descending channel on the hourly chart.
Why: A volume surge, up sharply on the day, pushed price well above its recent range and its key moving average.
Short-term range: Roughly $0.0161 to $0.0374 over the next two to four weeks, based on current support and resistance.
Invalidation: A close below $0.00353 would break the current bullish structure entirely.
Orchid OXT Snapshot: Price and Market Data
Metric | Value |
Coin Name | Orchid |
Ticker | OXT |
Blockchain | Ethereum (ERC-20) |
Today High | $0.0358 |
Today Low | $0.009035 |
RSI Level (1H) | 51.02 |
Token Type | Utility, privacy and bandwidth |
Token Category | Privacy / DePIN |
Market Cap | $17.65M |
24H Volume | $52.81M |
24H Volume Change | +247.68% |
Circulating Supply | 997.21M OXT |
24H Change | +83.18% |
Contract Address | 0x4575f41308EC1483f3d399aa9a2826d74Da13Deb |
Data as of July 18, 2026. According to CoinMarketCap data, OXT's market cap sits near $17.65 million with 24-hour volume above $52 million, a volume-to-market-cap ratio of over 300%, a signal of unusually heavy trading activity relative to the coin's size.
Source: CoinMarketCap Orchid page
What Is Orchid (OXT) and Why It Exists
Orchid is a decentralized VPN and bandwidth marketplace built on Ethereum, letting users pay for private, censorship-resistant internet access with OXT tokens. It launched its mainnet in 2019 and built its niche around privacy infrastructure rather than speculation. The token runs on the OXT token contract at address 0x4575f41308EC1483f3d399aa9a2826d74Da13Deb.
Orchid Price History and Recent Performance
OXT's all-time high sits at $1.02, reached back in April 2021, meaning the token is still down more than 98% from that peak even after this week's surge. On the other end, according to CoinMarketCap, the coin's all-time low of roughly $0.00299 was set less than three weeks ago, on June 29, 2026. That means this rally has come almost directly off a fresh cycle bottom, up over 480% from that low point.
Source: CoinMarketCap
That context matters. A bounce this sharp off an all-time low usually reflects short covering and speculative rotation into a beaten-down small cap, not necessarily a fundamental repricing, especially with broader risk appetite still shifting after this year's crypto market crash episode. It does not make the move fake, but it does mean the burden of proof is on the bulls to hold these gains.
Why Orchid Is Getting Attention Right Now
Part of this move is pure market rotation. Capital has been cycling hard into low-cap, high-beta names, a pattern showing up across the broader altcoin market right now, and OXT's tiny market cap made it an easy target for a fast squeeze. But there's also a real usage layer under this token that separates it from a pure meme rally: it powers an actual decentralized VPN product, and privacy demand has been a persistent narrative across this cycle.
Whale and holder data adds nuance here. According to Etherscan holder data, OXT has 46,914 holders on-chain. But concentration is heavy: the top 100 wallets control 86.51% of the supply, and just 31 whale wallets, only 0.07% of all holders, hold nearly 76% of the market cap. That is a market structure where a handful of actors can move price sharply in either direction.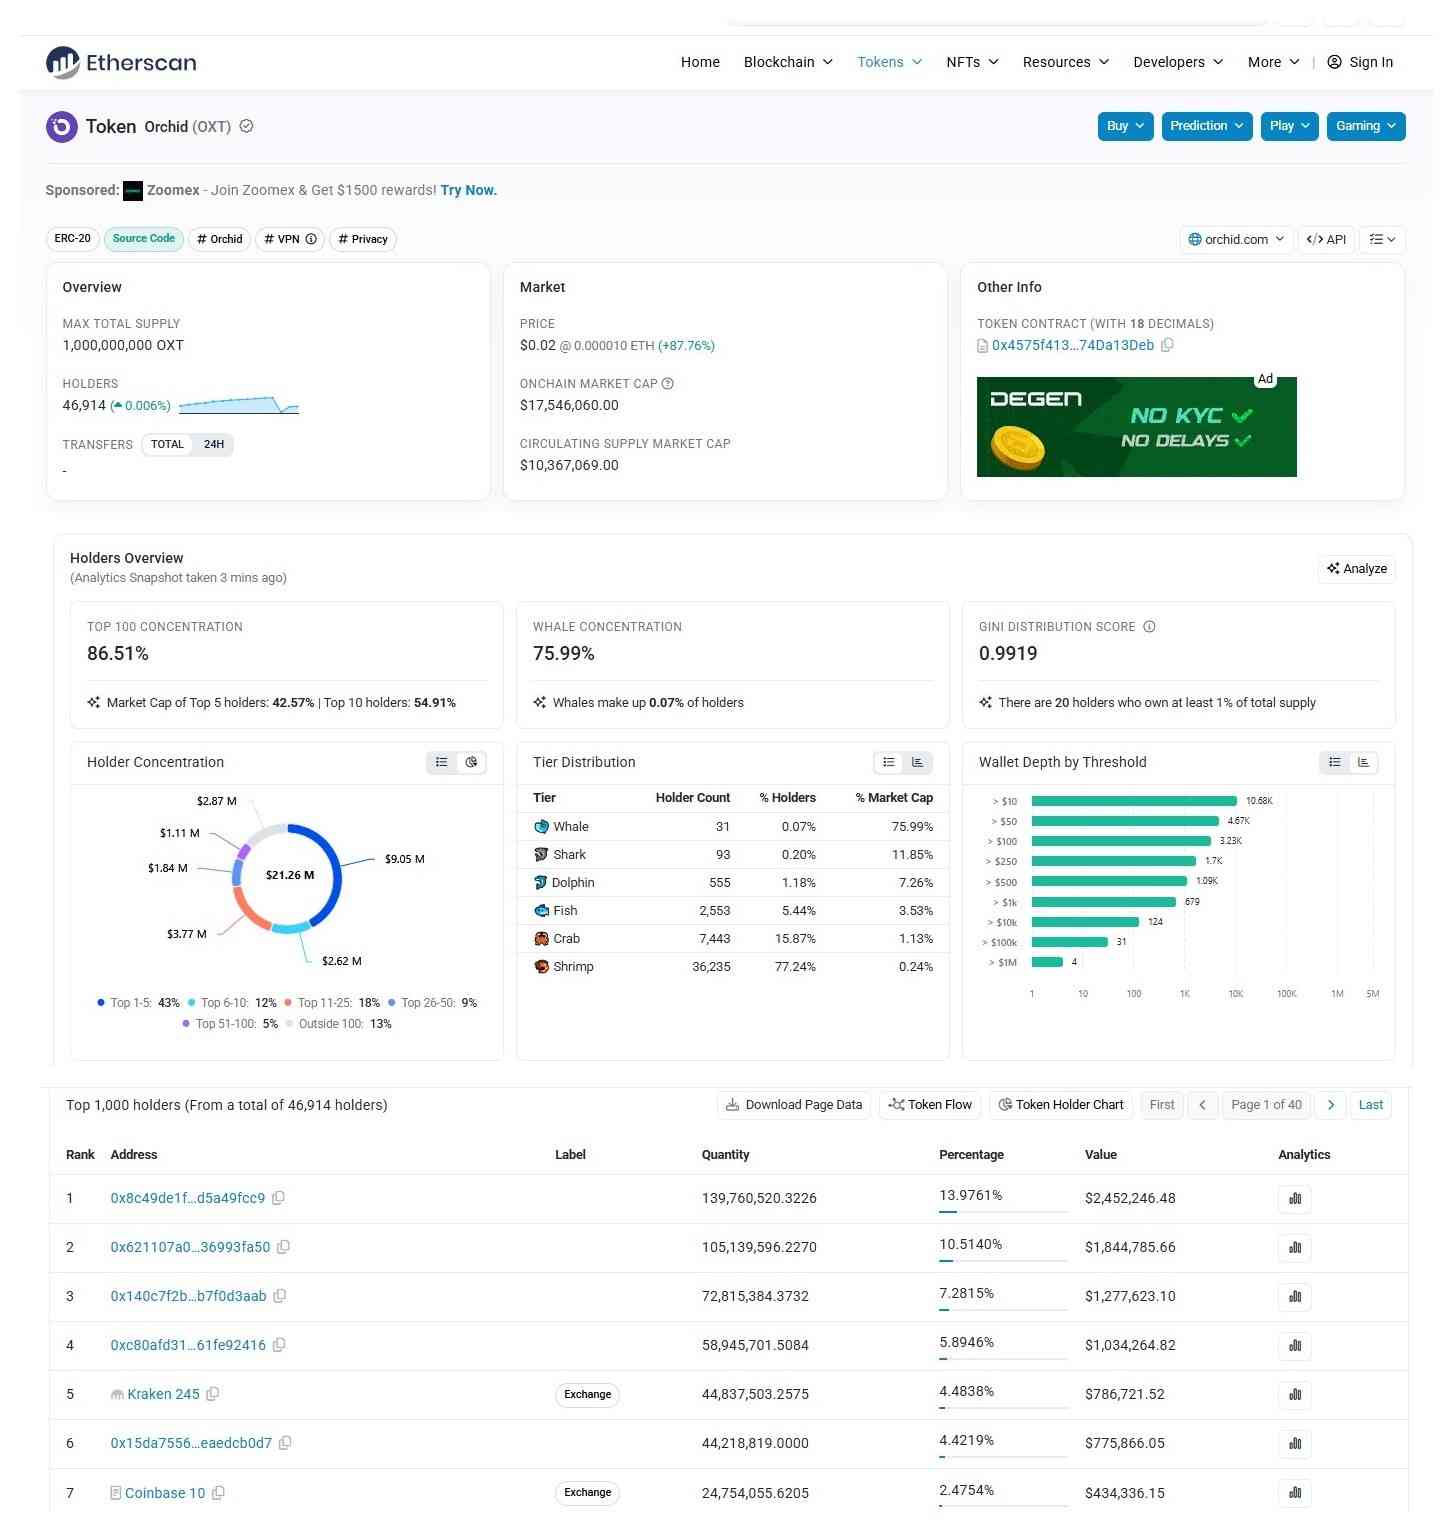
Source: Etherscan token page
Orchid Liquidation Data
As per CoinGlass liquidation data, liquidation activity around OXT has been minimal in dollar terms: $61.97 in long positions liquidated across the past 1, 4, 12, and 24-hour windows, with zero short liquidations in any window. Turns out this rally has not been driven by a leveraged short squeeze at all. It looks more like real spot demand than a derivatives-driven spike, which is a somewhat healthier signal for the move's durability.
Source: CoinGlass currency data
Orchid Fundamental Analysis and Tokenomics
OXT has a total supply of 1 billion tokens, with 997.21 million currently circulating, according to CoinMarketCap.
No token unlock schedule data was supplied, so unlock-driven supply risk cannot be assessed here and should not be treated as ruled out. Onchain market cap is listed at $17,546,060 versus a circulating-supply market cap of $10,367,069, a gap that traders should be aware of when sizing positions.
Source: Etherscan
OXT Technical Price Analysis: Breakout Under Pressure
Buying pressure, not hype alone, is what pushed OXT through its prior range: volume surged over 247% in 24 hours according to CoinMarketCap, and that kind of participation is what turns a bounce into a breakout. 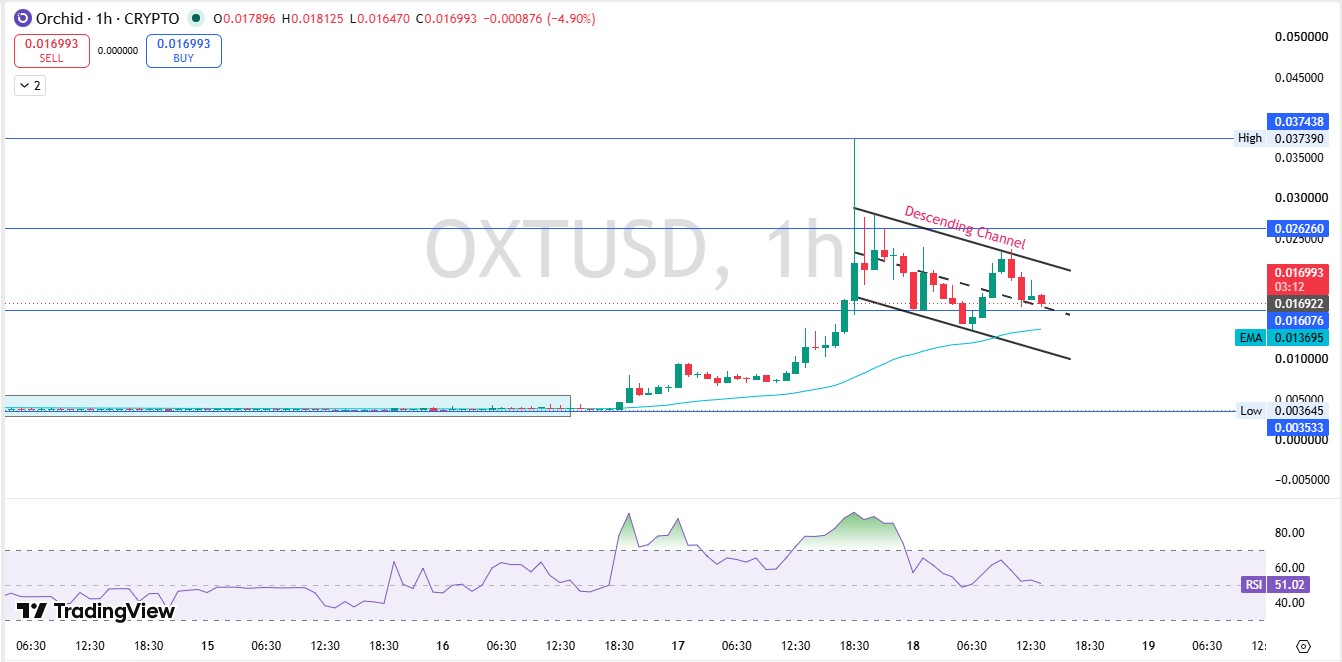
Source: TradingView charts
Price is now trading at $0.016993 on the hourly chart, sitting inside a descending channel just below its midline. That's a short-term bearish structure fighting an underlying bullish trend.
The 50 EMA sits at $0.013695, well below the current price, meaning buyers are still broadly in control. RSI reads 51.02, a neutral zone with no divergence either way.
Immediate support sits at $0.016076.
Resistance stacks up at $0.026260, then $0.037438. A volume-backed close above the first resistance opens the door toward the second. Lose $0.016076, though, and short-term consolidation becomes likely before the next real move.
Orchid Volume Heatmap
According to CoinGlass, Kraken is currently the dominant venue for OXT futures activity, holding roughly $80,650 in tracked volume, the largest single share visible in the heatmap data. Concentrated exchange volume like this means liquidity is thinner and more fragmented than it would be for a large-cap asset.
Source: CoinGlass
Orchid vs Other Privacy and DePIN Tokens
Compared to other small-cap privacy and decentralized infrastructure tokens, OXT's current volume-to-market-cap ratio of over 300% is extreme, well above what most peer projects in the privacy-and-bandwidth category typically show during normal trading, where ratios in the 10 to 30% range are far more common.
That gap is what creates real information value here: this is not an ordinary trading day for OXT; it's an outlier volume event, and outlier volume events in small caps tend to mean-revert once the initial squeeze burns out.
OXT Forecast: Next 24 Hours to 4 Weeks
Momentum favors the bulls short term, but the descending channel on the hourly chart means the next few sessions will likely decide whether this breakout extends or stalls out.
Timeframe | Bearish Level | Bearish Target | Pivot / Base Level | Base Target | Bullish Level | Bullish Target | Invalidation |
24 Hours | Key Support | $0.01608 | Current Price | $0.01699 | 50 EMA Reclaim | $0.01880 | Break below $0.01608 |
3–7 Days | Lower Weekly Support | $0.01199 | Key Weekly Support | $0.01699 | Key Resistance | $0.02626 | Lose $0.01199 |
2–4 Weeks | 24H Low Support | $0.00904 | Consolidation Midpoint | $0.01886 | Major Resistance | $0.03744 | Weekly close below $0.00904 |
Source: TradingView (1H) | Traditional Pivot Points | 50 EMA
These ranges come from the current support and resistance zones on the hourly chart plus how RSI has behaved near similar levels on the weekly chart. Watch the $0.01608 support closely: hold it, and the bullish case stays intact; lose it, and this starts looking like a fade similar to recent moves covered in this Bitcoin price forecast.
Three Orchid Price Scenarios
Scenario | Price Range | What Triggers It |
Worst Case | $0.0035 - $0.0090 | Breakdown below invalidation, liquidity dries up, holders exit |
Base Case | $0.0161 - $0.0263 | Price holds current range, and the channel resolves sideways to up |
Best Case | $0.0374 - $0.0644 | Volume sustains, breakout clears both resistance levels |
Key OXT Price Levels to Watch
Resistance zone: $0.02626 to $0.03744. A confirmed close above this range on rising volume would confirm the breakout is real, not a wick.
Support zone: $0.01608, backed by the 50 EMA near $0.01370. This is the line that keeps the short-term bullish structure alive.
Invalidation zone: $0.00353. A weekly close below this level would erase the entire bullish thesis and point back toward the recent all-time low.
Risk Factors for OXT
Liquidity risk: With most tracked futures volume concentrated on a single exchange, large orders can move price fast in either direction.
Small-cap volatility: A market cap under $20 million means normal-sized trades can swing prices double digits in a single session.
What breaks the thesis: A close below $0.00353, a broader market crash dragging down small caps, or a sudden drop in the volume that has powered this move so far. Keeping an eye on the crypto events calendar can help flag catalysts before they hit price.
Analyst View and Final Thoughts
This chart tells a fairly clean story right now. Volume led, price followed, and the 50 EMA confirms buyers are still in charge of the broader trend.
But the descending channel on the hourly timeframe is a real warning sign. It's the kind of pattern that either breaks upward on strong volume or slowly bleeds out toward its lower boundary.
A weekly close above $0.02626 would be the clearest signal that this move has real staying power, not just a fast squeeze off a fresh low.
RSI sitting near 51 gives no strong signal either way right now. Neither overbought nor oversold, it's a market waiting for its next catalyst.
The single biggest external factor to track here is whether volume stays elevated. Ratios this high, over 300% of market cap traded in a day, rarely persist for long, a dynamic also worth watching in this Ethereum price outlook for how larger assets are handling similar volume swings.
The most important level on the whole chart remains $0.01608. Everything bullish about this Orchid price prediction depends on that line holding.
This is a real breakout with real volume behind it, but it's happening in a token where 31 wallets control three-quarters of the float, and that combination deserves respect, not blind confidence.
Key Takeaways
OXT rallied sharply on a volume surge, trading above its 50 EMA.
The hourly chart shows a descending channel, a near-term risk inside a longer bullish structure.
Support at $0.01608 and resistance at $0.02626 and $0.03744 are the levels that matter most.
Holder concentration is high, with whales controlling roughly 76% of supply.
The long-term case depends on volume staying elevated well beyond this initial squeeze.
Disclaimer: This article is for educational purposes only and does not constitute financial advice. Crypto markets are volatile. Consult your investment advisor before making any investment decision.
0
0
 Manage all your crypto, NFT and DeFi from one place
Securely connect the portfolio you’re using to start.