
Dogecoin Price Prediction: Strongest DOGE Inflows Since Launch

0
0

Dogecoin price prediction chatter is picking up again, and a tightening chart is the reason. Compare that to the Bitcoin price prediction coverage, where the larger market is fighting its own squeeze this week. Dogecoin is showing a similar setup on the 4-hour chart.
According to a post shared on X, Grayscale's Dogecoin fund pulled in close to $2,600,000 over the past month. That's the strongest inflow level the fund has seen since launch.
Dogecoin started in 2013 as a joke built on the Shiba Inu meme, then turned into one of the most traded coins in crypto history.
Elon Musk News around the token has cooled since its peak cycle, but this week's real catalyst came from fund flow data instead. And that shift toward institutional interest is part of why this Dogecoin price prediction matters now.
$DOGE is trading near $0.09733, up 2.4% on the day. Market cap sits around $15.191 billion, with circulating supply near 156 billion tokens. The Dogecoin price today shows a market holding steady after a strong month.
Live $DOGE Market Data
Metric | Value |
Price | $0.09733 |
24H Change | +2.4% |
24H Range | $0.09461 - $0.0997 |
Market Cap | $15.191B |
Source: market data taken from CoinGecko, as of Sep 26, 2026. Figures may vary slightly across other tracking websites.
Dogecoin ETF Data and Fund Flows
A post from an investment-focused account, shared around Sep 25, 2026, 17:37 UTC, reported fresh Dogecoin ETF data worth noting. Grayscale's Dogecoin fund reportedly brought in approximately $2,600,000 over the past month, the strongest inflow pace since the fund's launch.
Source: Data Taken From @Investments_CEO, X Account, as of Sep 26, 2026
That's a real number, not a rumor. But one month of inflows doesn't rewrite a multi-year chart on its own. And fund managers rarely deploy capital without conviction behind it.
Talk of DOGE whale accumulation tends to follow data like this. Fund inflows aren't the same as wallet-level whale buying, though the two often get mentioned in the same breath online.
Dogecoin Chart Technical Analysis
This Dogecoin technical analysis starts with the pattern squeezing price right now.
On the 4-hour chart, $DOGE sits inside a symmetrical triangle, a pattern formed by a falling trendline from above and a rising trendline from below meeting at a point. 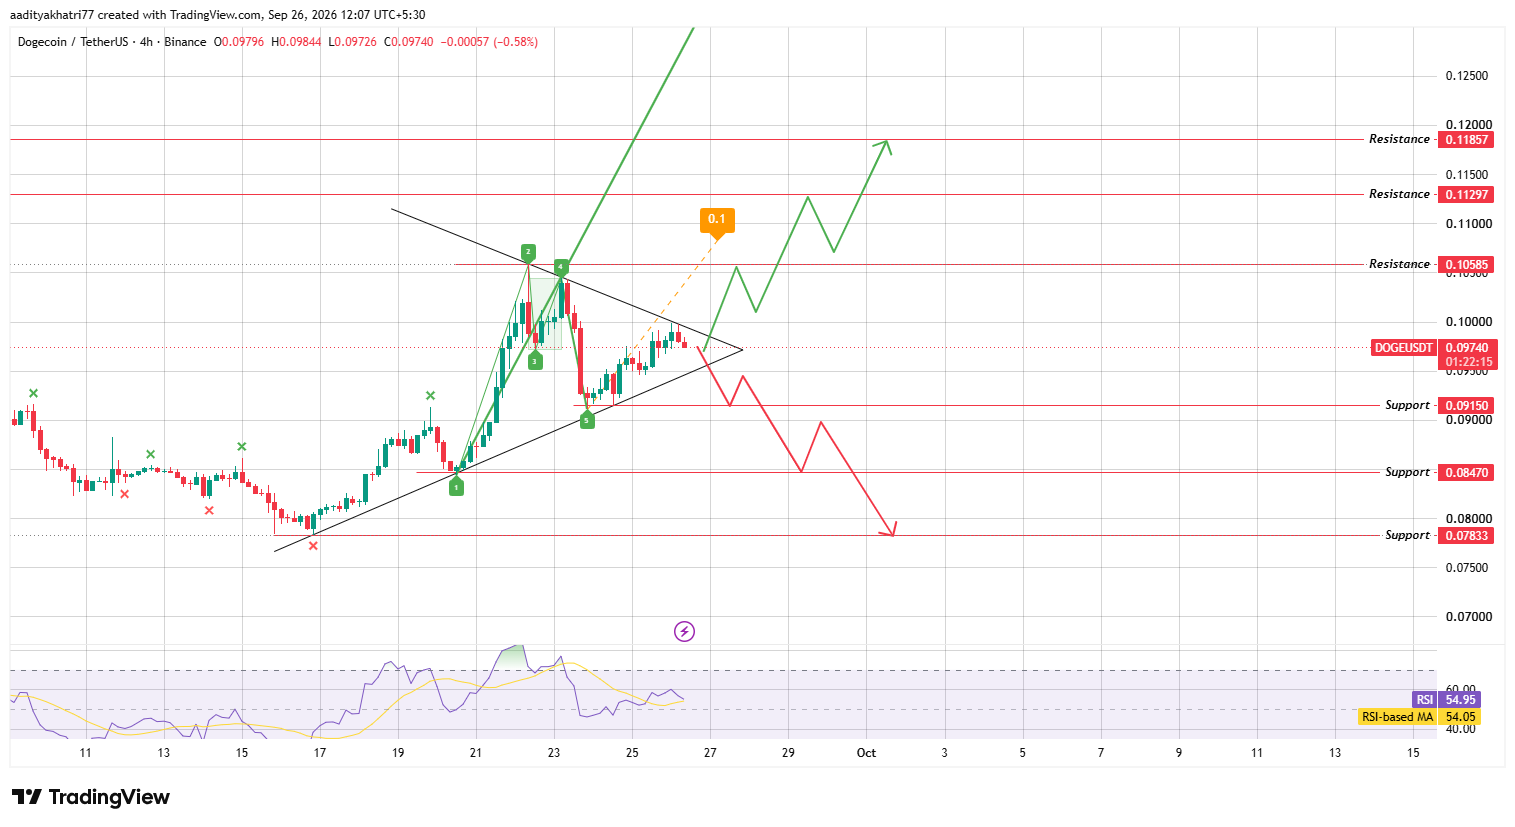
Source: Chart taken from TradingView, as of Sep 26, 2026
RSI reads 54.95, just above its moving average of 54.05. That's a mild lean, not a strong one, and the triangle is nearing its apex.
Can $DOGE Push Toward Higher Resistance?
A 4-hour trade above the falling trendline, backed by real volume, opens the path toward $0.10585 first.
A wolfe wave structure on the same chart marks five swing points and projects an extended move toward $0.11297, with $0.11857 as the stretch target if buyers stay in control.
That's the bullish case. And it needs volume behind the break, not just a wick above the line.
What Happens If $DOGE Breaks the Rising Trendline?
Rejection at resistance flips the setup fast. And a break of the rising trendline and the $0.09150 support below it would send $DOGE hunting for $0.08470. Lose that too, and $0.07833 becomes the next real floor.
Breakdowns from triangles this tight tend to move quick once support gives way. Fine. That's the risk on the other side of this trade.
Support | Resistance |
$0.09150 | $0.10585 |
$0.08470 | $0.11297 |
$0.07833 | $0.11857 |
Bull, Base, and Bear Scenarios
Scenario | Setup | Level |
Bull | Trendline break with volume | $0.10585 to $0.11857 |
Base | Triangle holds, range trade | $0.09150 to $0.10585 |
Bear | Support and trendline break | $0.08470 to $0.07833 |
Dogecoin vs Bitcoin
Bitcoin's own tightening range tends to set the tone for how meme coins like DOGE trade in the short term.
A risk-on tape helps triangle breakouts hold above resistance. A risk-off move tends to drag DOGE's support levels down regardless of what fund flow data says that week.
Methodology
This Dogecoin price prediction was built from a 4-hour DOGEUSDT chart sourced through Binance via TradingView, checked candle by candle for the triangle boundaries and the wolfe wave swing points.
Support and resistance levels came directly from the marked price zones on that chart.
Live price, market cap, and fund flow figures came from separate data snapshots taken the same day.
Nothing here substitutes for independent research; markets move fast, and a chart pattern only describes probability, not certainty.
Expert Opinion
Market commentary around Dogecoin news today leaned cautiously constructive.
Analysts pointed to the Grayscale inflow data as a sign institutional demand hasn't disappeared, while flagging that the triangle apex near late September is the real test.
Turns out, a strong fund flow month means little if DOGE can't clear $0.10585 with volume behind it.
Disclaimer: This article is for informational purposes only and does not constitute financial advice. Cryptocurrency markets, including Dogecoin, carry high volatility and downside risk; prices can move sharply against any projected level, and past performance offers no guarantee of future results. Readers should conduct independent research before making any investment decision.
0
0


 Manage all your crypto, NFT and DeFi from one place
Securely connect the portfolio you’re using to start.


