Ethereum Price Weekly Outlook: Key Levels to Watch

0
0

Ethereum (ETH) price started the first week of June 2025 with relatively muted price action, holding around $2,500 despite growing anticipation in broader crypto markets. Both the hourly and daily Ethereum price charts reveal critical technical structures, and a breakout—or breakdown—appears increasingly likely this week.
Ethereum Price Prediction: Is Ethereum Price Losing Momentum?
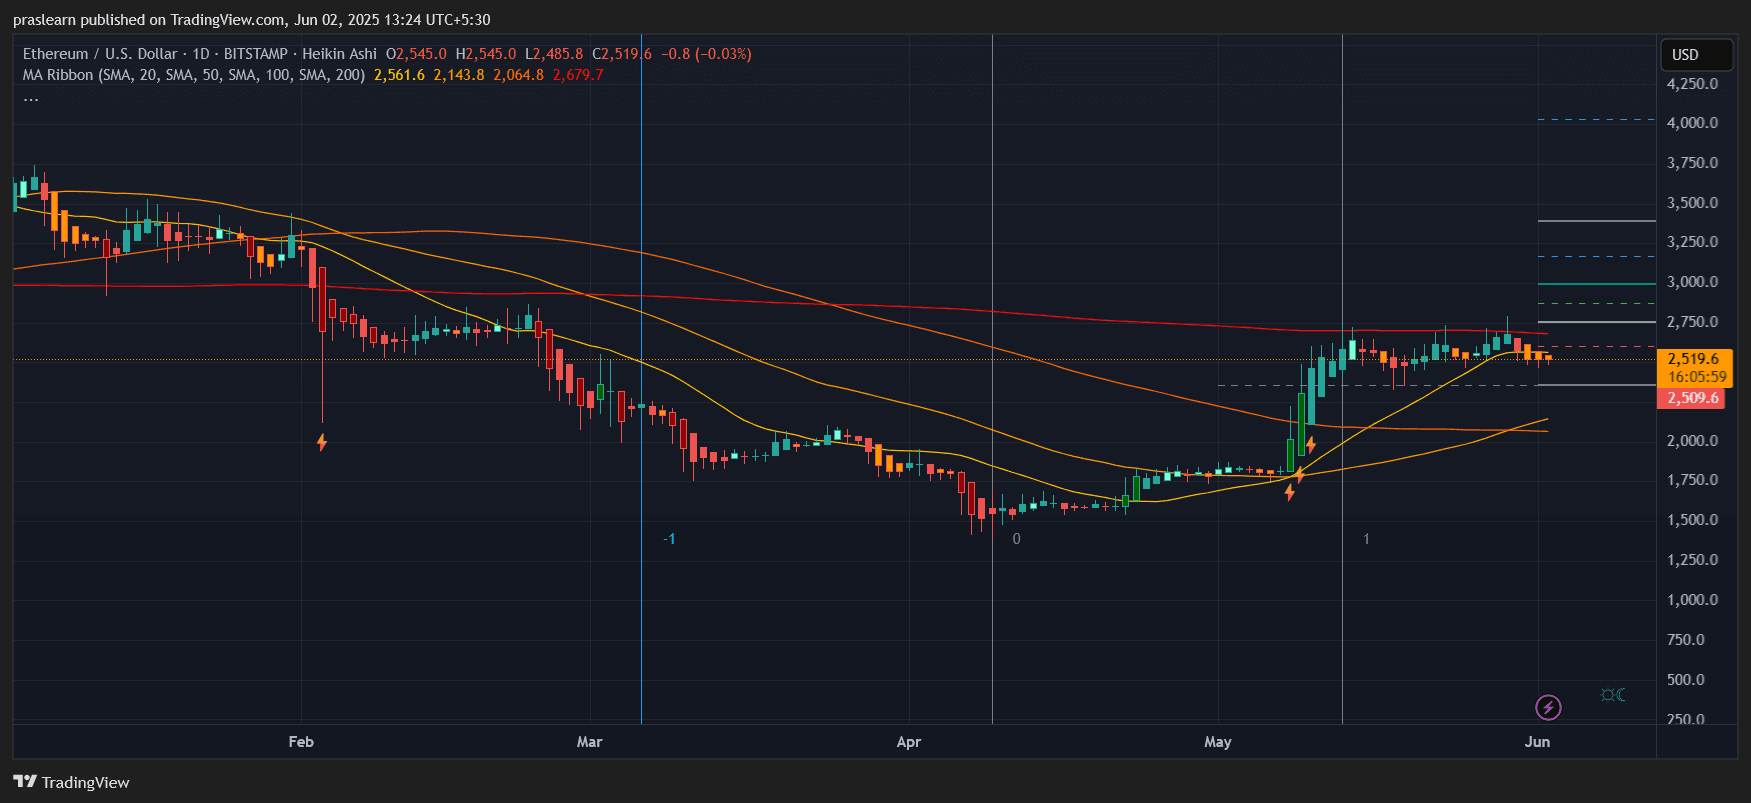
On the daily chart, Ethereum price has been consolidating just below the 200-day Simple Moving Average (SMA), currently near $2,680. This moving average acts as a major dynamic resistance. ETH price recently attempted a breakout above $2,700 but failed to hold, pulling back into a tight consolidation channel.
The last three daily candles show indecision, with smaller bodies and long wicks, hinting at equal pressure from both bulls and bears. Ethereum price is trading around $2,519, just above the 20-day and 50-day SMAs, which are converging near $2,145 and $2,065, respectively. This confluence of support is holding ETH price up, but the resistance at the 200 SMA must be broken for a sustained rally.
What Does the Hourly Chart Reveal?

The hourly chart paints a more cautious picture. Ethereum price is trading under all major SMAs — the 20, 50, 100, and 200 — which are stacked bearishly. The most immediate resistance lies at $2,521 (SMA 20) and $2,571 (SMA 50). The latest hourly candle is priced around $2,504, suggesting slight bullish attempts, but ETH price has failed multiple times to break above $2,520 convincingly.
This indicates short-term bearish pressure and a potential liquidity sweep below current lows to test deeper support. The price is currently caught in a narrow range between $2,485 and $2,520.
Where Is Ethereum Price Headed Next?
Using the Fibonacci retracement from the recent swing low ($1,620 in April) to the high near $2,750 in May:
- 38.2% Fib retracement = $2,357
- 50% retracement = $2,185
- 61.8% retracement = $2,012
Ethereum price has so far respected the 38.2% retracement zone, holding support just above $2,350. If ETH closes a daily candle below $2,500, expect a test of the $2,350-$2,185 support band this week. The failure to hold $2,185 would open the door to $2,000 psychological support.
On the upside, Ethereum price must reclaim $2,571 (50-hour SMA) and then challenge the critical resistance zone of $2,680–$2,750. A strong break above $2,750 would trigger bullish continuation toward $3,000 and $3,250 as shown in the upper Fibonacci extensions.
Ethereum Price Prediction: Are Bears in Control for Now?
Short-term structure shows that bears are slightly in control. Ethereum’s failure to break above hourly SMAs and the squeeze between lower highs and consistent lows points to a bearish triangle pattern formation. Volume is drying up, indicating a likely sharp move within 48–72 hours. The direction will be dictated by whether $2,500 holds or breaks.
From a calculated perspective:
- If ETH price closes hourly below $2,485, expect a measured move down to $2,350
(Target = Support Zone = $2,485 - ($2,520 - $2,485) = $2,450 - $2,485 = $2,450) - If ETH price breaks above $2,571, the next targets are $2,680 and $2,750.
Weekly Outlook: What Should Traders Watch?
This week, the price of Ethereum is likely to remain range-bound until a clear breakout or breakdown happens. Traders should closely watch:
- $2,500 support zone
- $2,570 short-term resistance
- $2,750 as a decisive breakout zone
If Bitcoin remains stable and Ethereum price breaks $2,750, expect a renewed bullish momentum toward $3,000. However, a failure to hold $2,500 could drag ETH down to $2,185 or lower.
0
0

 Manage all your crypto, NFT and DeFi from one place
Securely connect the portfolio you’re using to start.

0
0

0
0

0
0

0
0