Whales Buy $7.5M AAVE: Is $440 Next After “Umbrella” Slashing Goes Live?

0
0
Aave AAVE $251.1 24h volatility: 3.9% Market cap: $3.80 B Vol. 24h: $472.88 M is currently trading around $250, down by 4% in the past day. Although the 29th largest cryptocurrency has seen a market cap decline of over $200 million, bullish momentum is steadily growing among traders and analysts.
This optimism follows the recent launch of Aave’s new “Umbrella” system, a fully on-chain, staking-based risk management mechanism designed to improve capital efficiency and automated coverage of bad debt.
Umbrella replaces the previous Safety Module and allows users to stake “aTokens” such as aUSDC, aWETH, and GHO. The system went live on Ethereum ETH $2 487 24h volatility: 4.3% Market cap: $300.29 B Vol. 24h: $29.45 B on June 5 and is expected to expand to other chains soon.
Whales Make Significant AAVE Purchases Signaling Strong Investor Confidence
Earlier today, two whales responded to the launch, making major AAVE purchases and signaling strong investor confidence. On-chain data shared by LookOnChain shows that whale wallet 0x372c borrowed 5 million USDC from Aave and acquired 19,608 AAVE tokens.
With the latest purchase, this whale’s total holdings reach 280,673 AAVE, currently valued at $69.4 million.
2 whales bought 29,739 $AAVE($7.5M) again today.
0x372c borrowed 5M $USDC from #Aave to buy 19,608 $AAVE 11 hours ago, now holding 280,673 $AAVE ($69.44M).
0xeBb4 borrowed 2.5M $GHO to buy 10,131 $AAVE 7 hours ago, now holding 120,513 $AAVE ($29.8M).https://t.co/5jbsANln6A… pic.twitter.com/NWky0EYnu1
— Lookonchain (@lookonchain) June 6, 2025
Shortly after, another whale 0xeBb4 borrowed 2.5 million GHO and bought 10,131 AAVE tokens. This wallet now holds 120,513 AAVE, worth around $29.8 million.
These transactions came amid a broader sideways market, hinting that smart money is entering ahead of a potential breakout.
AAVE Price Outlook
On the daily AAVE price chart, the RSI is currently near 54, suggesting room for upward movement. A climb in RSI would strengthen the bullish case.
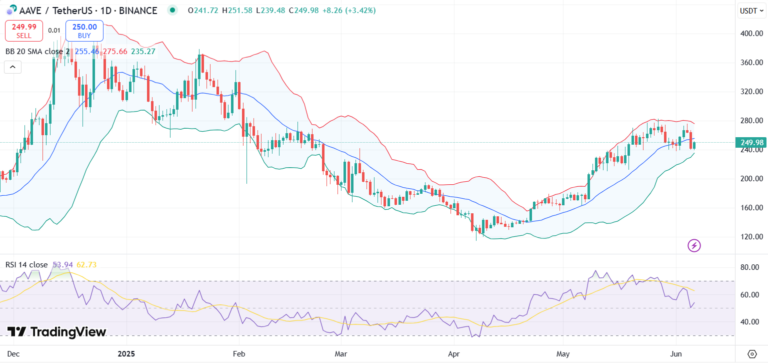
AAVE price chart with RSI and Bollinger Bands | Source: Trading View
Meanwhile, Bollinger Bands suggest consolidation near the mid band (20-day SMA) with resistance around the upper band at $280. AAVE is strongly holding the lower band, which offers support around $235, reflecting underlying buying interest.
However, the MACD is currently showing a bearish crossover with red histogram bars. This indicates that short-term momentum may remain under pressure unless bulls reclaim $260 quickly.

AAVE price chart with MACD | Source: Trading View
AAVE also appears to be forming an inverse head and shoulders pattern on the daily chart, usually a bullish signal. The neckline appears around the $280-$290 zone, which also aligns with Bollinger Band resistance.
Analysts believe that a breakout above the neckline could trigger a rally toward the pattern’s target near $440.
The post Whales Buy $7.5M AAVE: Is $440 Next After “Umbrella” Slashing Goes Live? appeared first on Coinspeaker.
0
0

 Manage all your crypto, NFT and DeFi from one place
Securely connect the portfolio you’re using to start.


