Arbitrum (ARB) Pumps 16% on Robinhood Hype — But Is a Pullback Coming?

0
0
ARB, the native token of the leading Layer-2 scaling solution Arbitrum (ARB), is today’s top-performing token. It is up over 16% today, fueled by growing speculation surrounding a potential partnership with Robinhood.
Interestingly, on-chain data suggests that the rally may be short-lived as key metrics flash warning signs.
Arbitrum Tops Gainers as Robinhood Speculation Runs Hot
ARB is up by double digits today and currently trades at $0.36. This comes ahead of the Monday fireside chat between Ethereum co-founder Vitalik Buterin, Robinhood Crypto General Manager Johann Kerbrat, and A.J. Warner, the Chief Strategy Officer at Offchain Labs, the team behind Arbitrum.
This upcoming meeting has fueled speculation that Arbitrum could be announced as a partner for Robinhood’s blockchain plans. The buzz is partly driven by a May 8 Bloomberg report, which revealed that the US-based platform is developing a blockchain-based platform, with Arbitrum reportedly being considered a potential partner for the venture.
However, despite the bullish price action, on-chain data indicates that the rally may face some challenges in the short term. For example, the token’s liquidation heatmap shows a substantial liquidity cluster below ARB’s price at $0.29, suggesting that a pullback could be on the horizon.
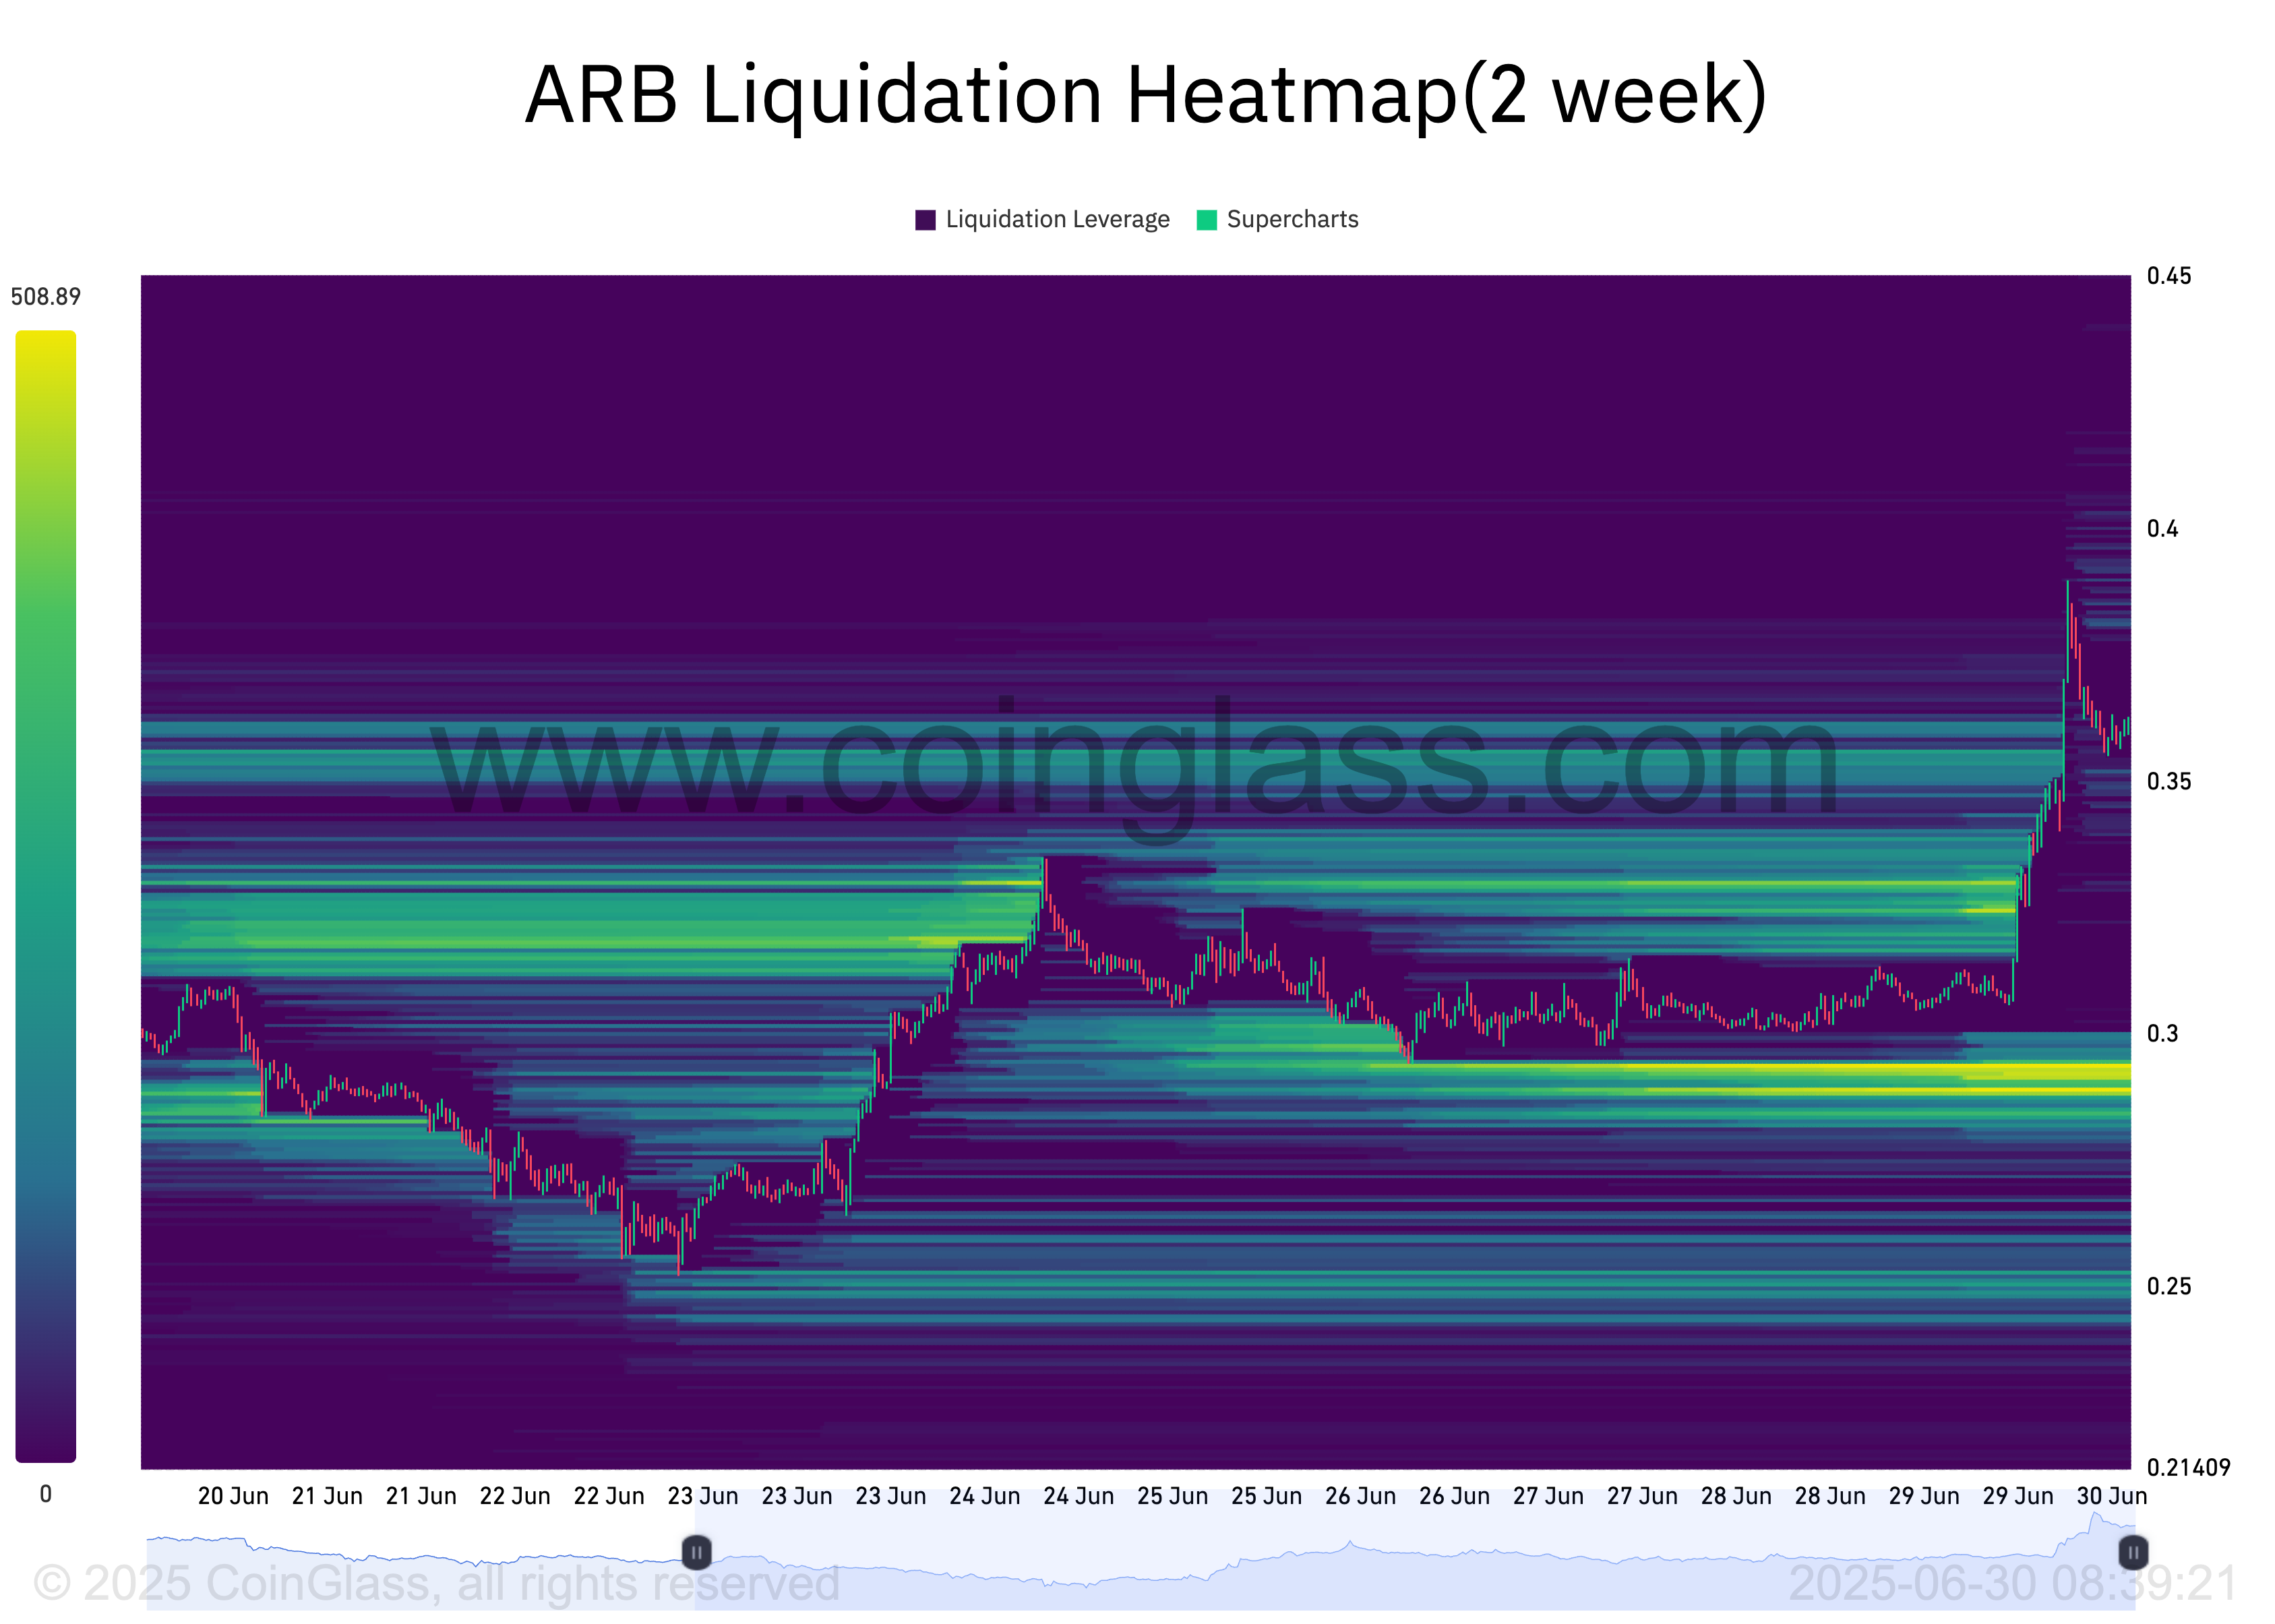 ARB Liquidation Heatmap. Source: Coinglass
Liquidation heatmaps are visual tools traders use to identify price levels where large clusters of leveraged positions are likely to be liquidated. These maps show areas of high liquidity, often color-coded to show intensity, with brighter zones representing larger liquidation potential.
When the heatmap shows a liquidity cluster below an asset’s price, many leveraged long positions have liquidation levels in that area. This acts as a magnet for price retracement, as the market may move down to trigger those liquidations before continuing in either direction.
Moreover, while its price climbs, the altcoin’s Chaikin Money Flow (CMF) indicator shows a noticeable downtrend. It is at -0.12 at press time, forming a bearish divergence with ARB’s price.
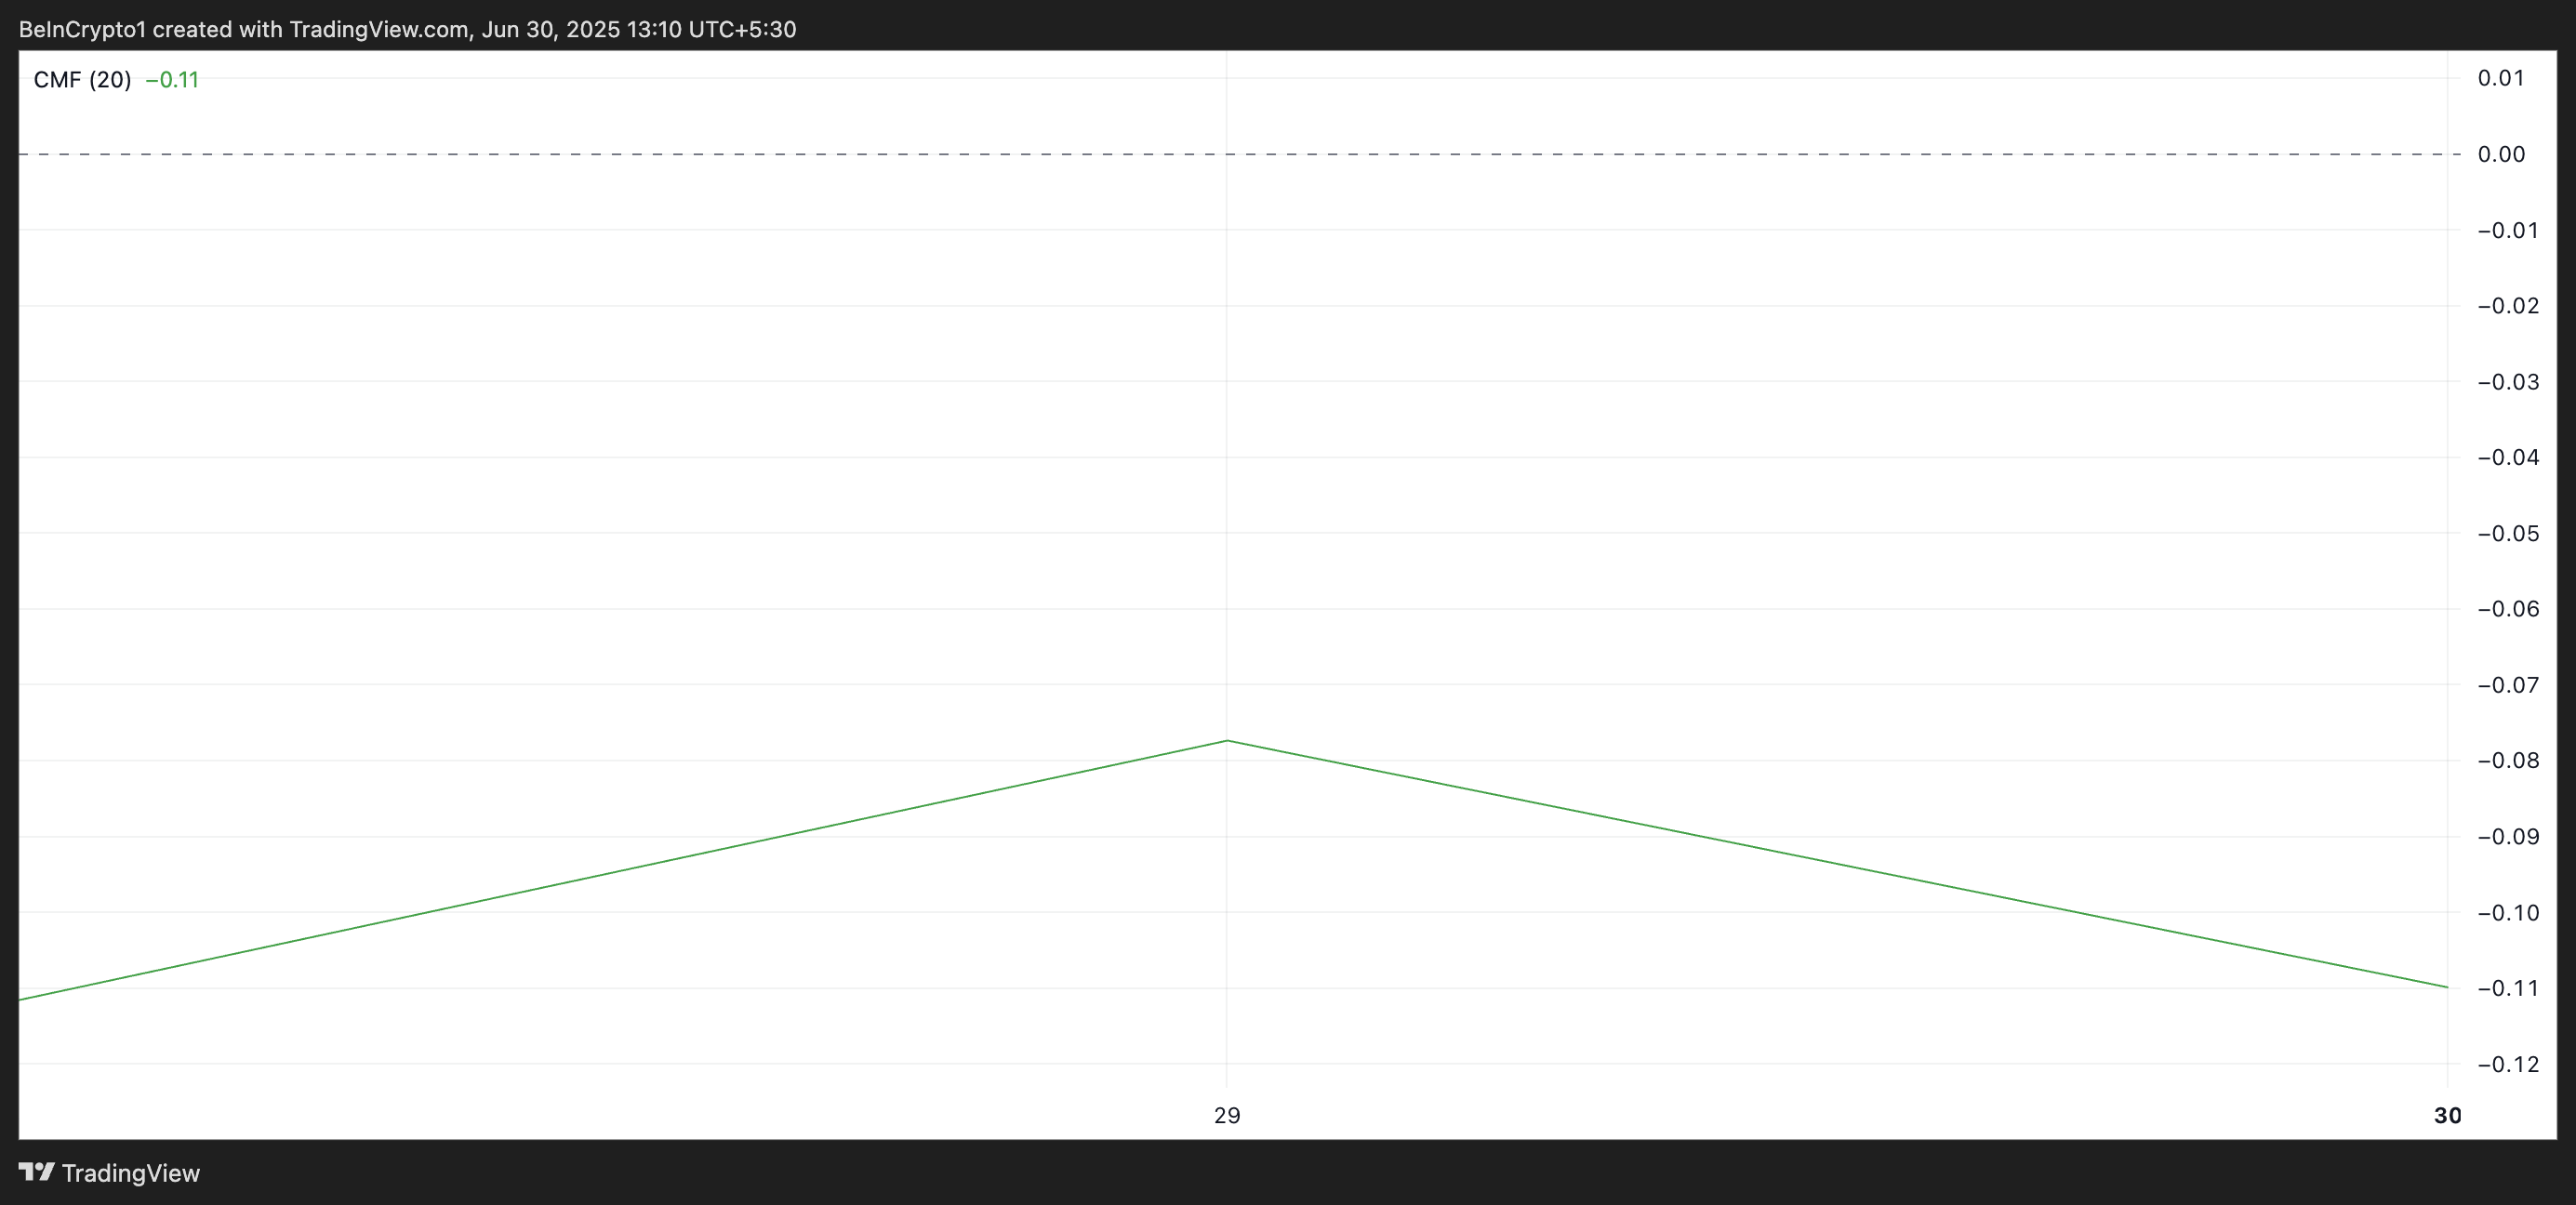 ARB CMF. Source: TradingView
This bearish divergence occurs when prices rise while money flow falls, indicating weakening buying pressure behind the rally. ARB could soon witness a correction if this trend persists, risking reversing some of its recent gains.
Arbitrum Bulls Face a Critical Test
At its current market price, ARB trades above key support at $0.29. This price point represents the crucial barrier preventing the token from revisiting its all-time low of $0.24.
If ARB’s rally continues to lack sufficient bullish backing, a breakdown below this level remains possible.
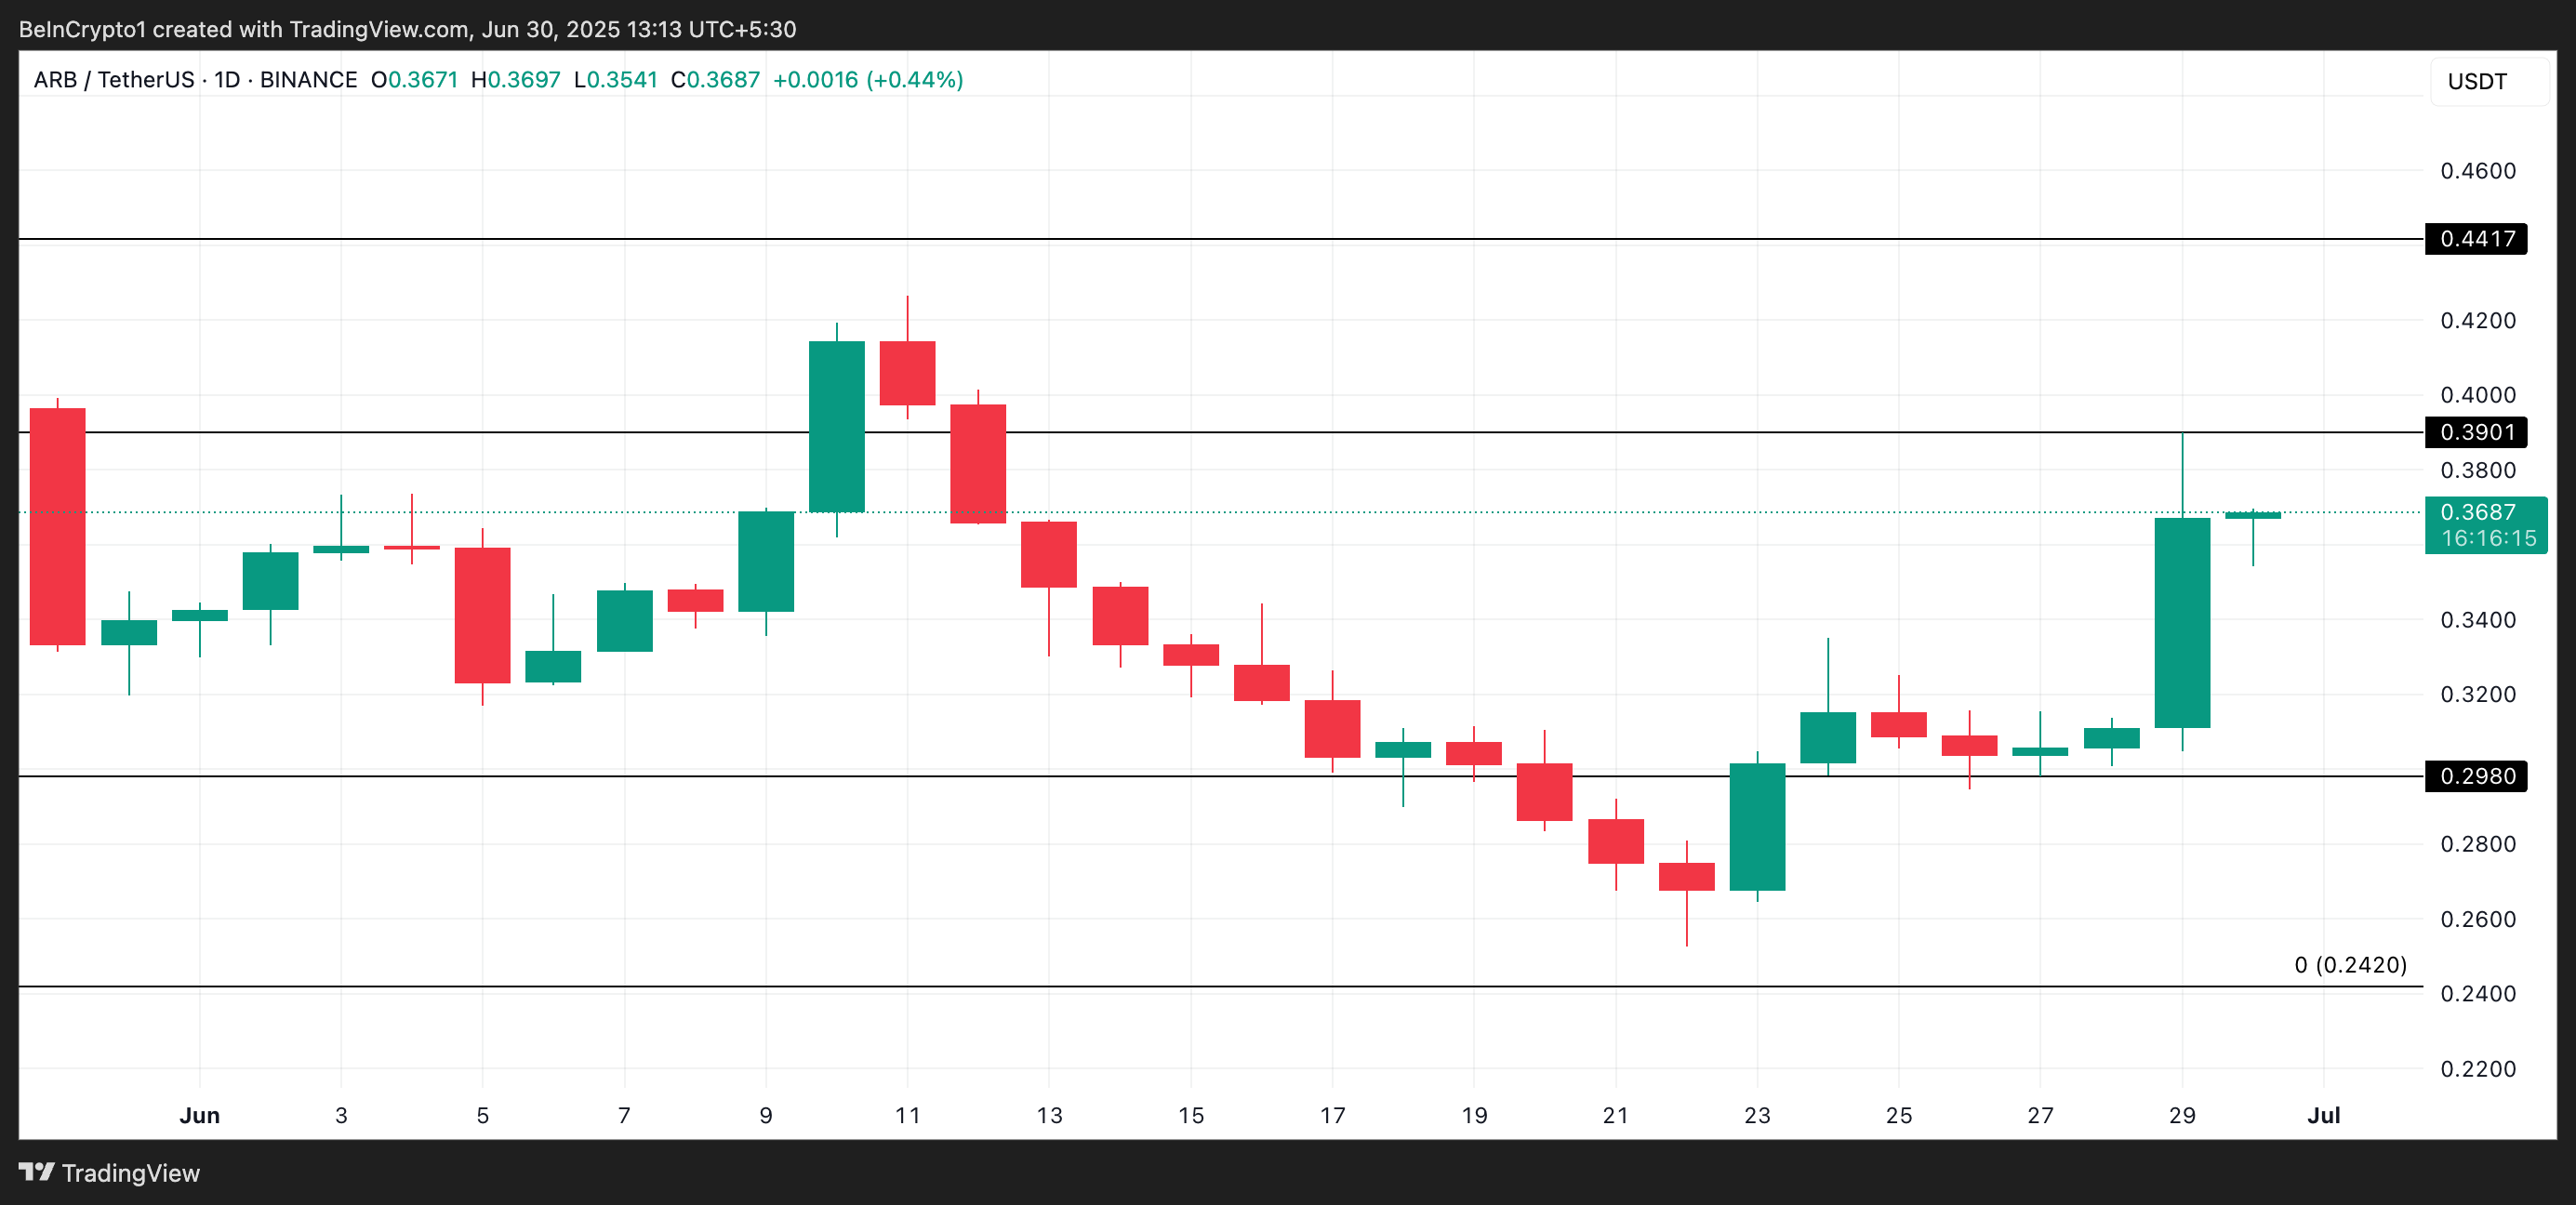 ARB Price Analysis. Source: TradingView
On the other hand, the token could climb toward the $0.39 mark if buying pressure spikes.
0
0


 Manage all your crypto, NFT and DeFi from one place
Securely connect the portfolio you’re using to start.


