A recent Glassnode report indicates that the current Bitcoin trend around its STH cost basis mirrors mid-bull cycle behaviors.
Notably, Bitcoin has faced pressure since falling from its all-time high of $123,000 in mid-July. Specifically, it dropped to $111,000 at the start of August before bouncing back above $116,000.
While the recovery has helped stabilize sentiment, investors still wonder whether the bull run has peaked. In its latest report, Blockchain analytics firm Glassnode suggested that the market remains in bullish territory, and that the current pullback doesn't signal the end of the cycle.
Bitcoin Sitting Well Above the STH Cost Basis
Glassnode highlighted the Short-Term Holder (STH) cost basis in its report. For the uninitiated, this figure tracks the average price paid by traders who bought Bitcoin within the last 155 days. Right now, the cost basis sits at $106,100.
Bitcoin continues to trade above this level, which historically separates bullish conditions from bearish ones. Glassnode believes this setup resembles the kind of structure seen in the middle of a bull market, even if the recent drop adds some short-term risk.
The accompanying chart supports this commentary. Specifically, Bitcoin climbed back above the STH cost basis in April 2025, after staying below it during a dip earlier in the year. This correction, which started in late February, pushed Bitcoin below $90,000. It stayed under pressure until April, when buyers stepped back in and pushed prices higher.
Bitcoin STH Cost Basis Model | Glassnode
Before the drop, Bitcoin first broke above the STH cost basis during this bull run in late 2024, shortly after Donald Trump's election victory. The rally lifted the price past $100,000, and Bitcoin held above $90,000 and $100,000 until the February setback. As of now, Bitcoin trades around $116,359, well above the $106,100 threshold.
However, even with this strong position, Bitcoin still struggles to move past the average entry price of recent short-term top buyers, another important metric. This figure sits at $116,900. Glassnode warned that failing to break above this level could extend the current sideways movement or even trigger another drop back toward $110,000.
https://twitter.com/glassnode/status/1953414568065245682
Bitcoin Seeing Accumulation, but Needs Higher Pressure to Form Solid Base
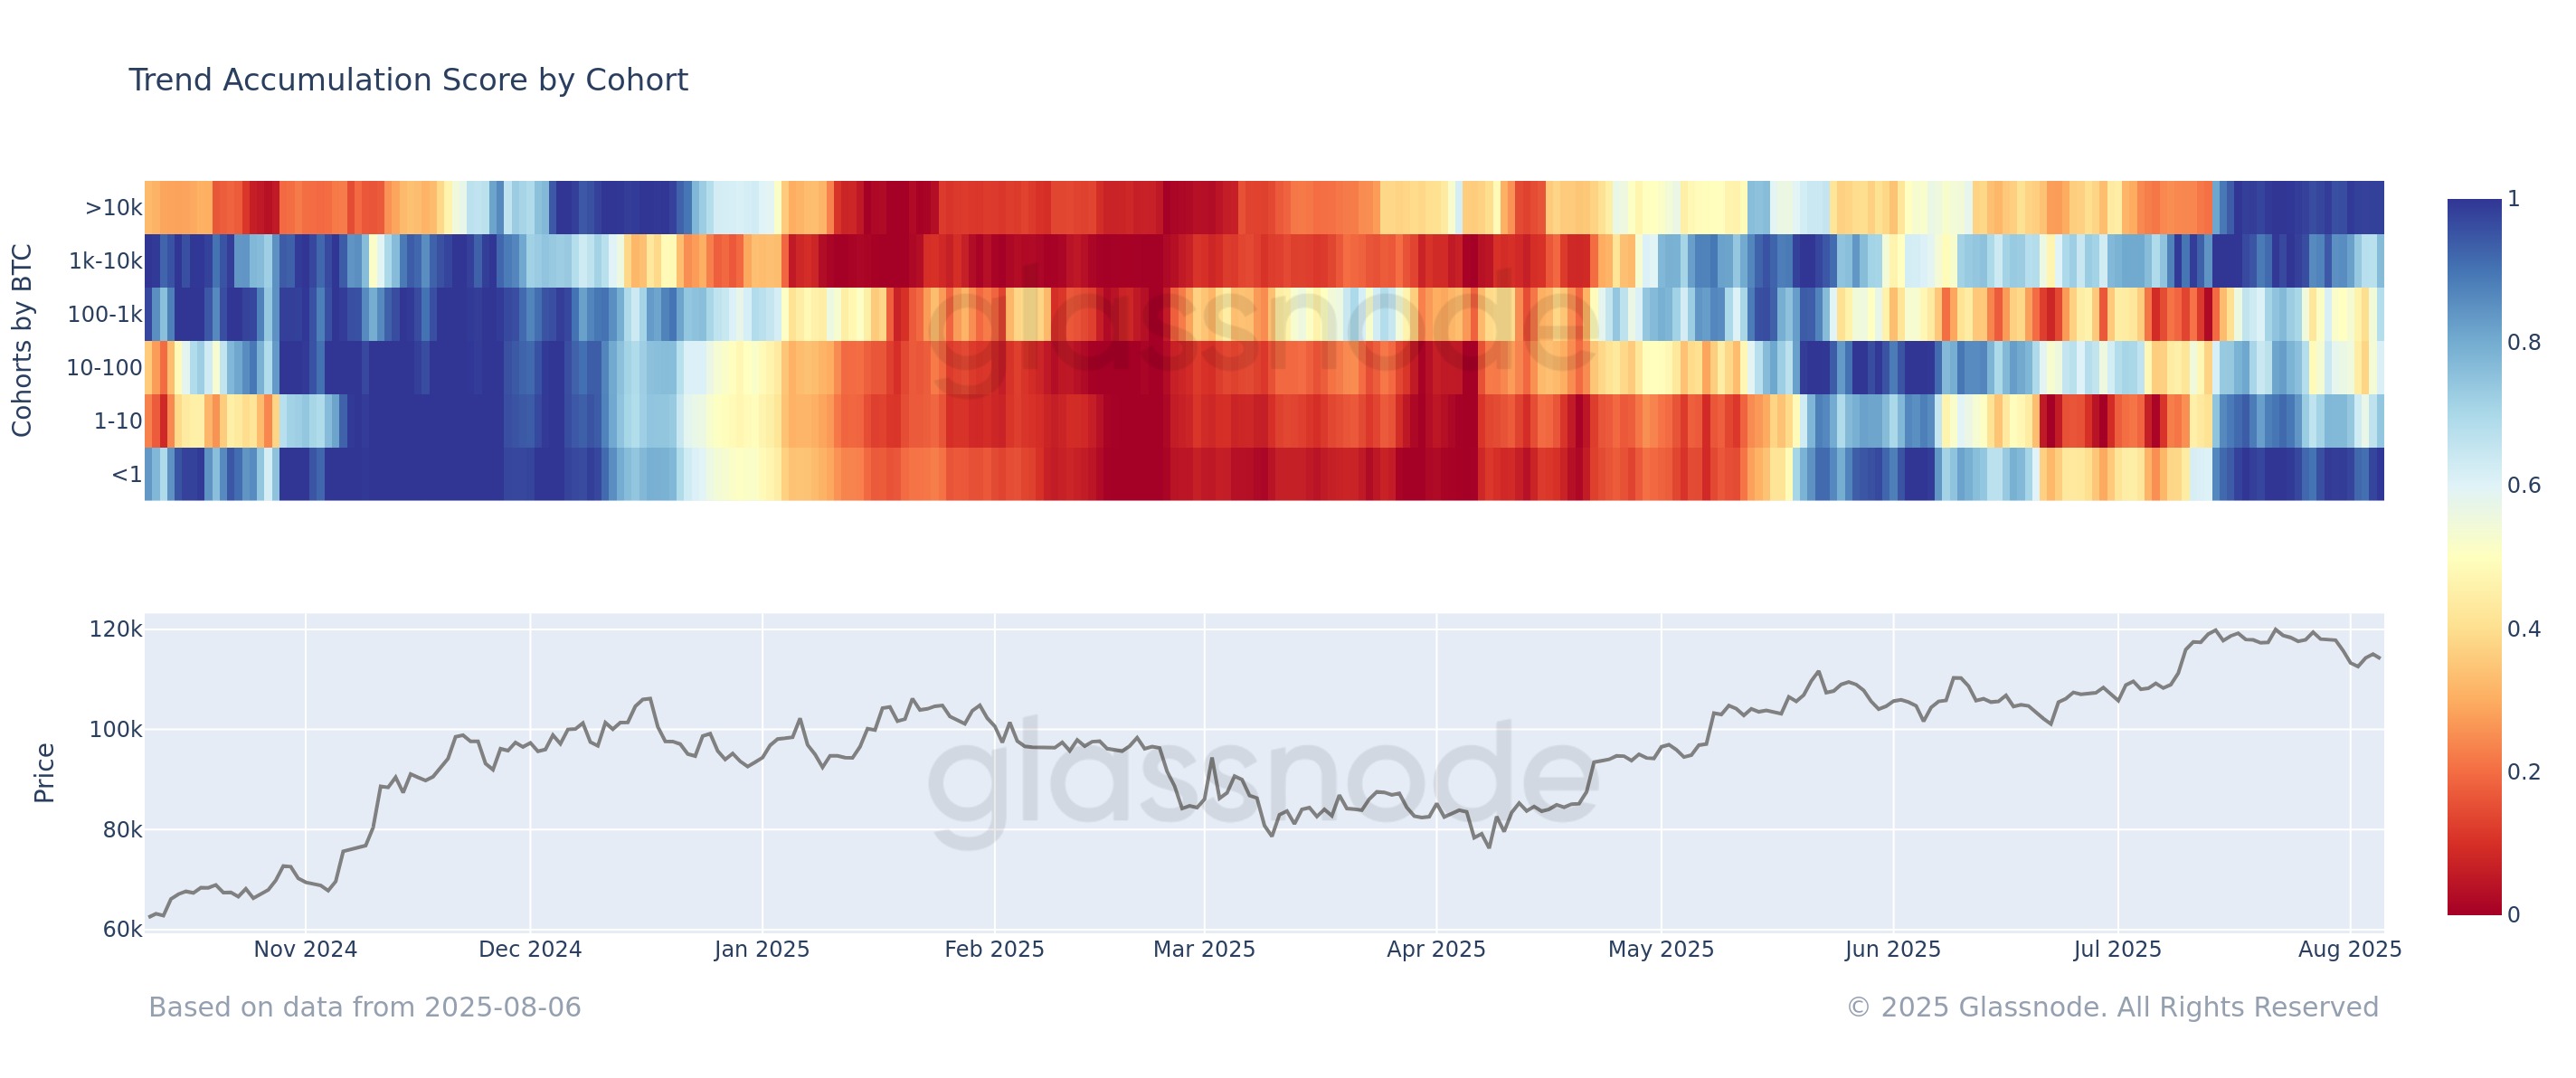
In another analysis, the firm confirmed that over the past 15 days, both whales, those holding over 10,000 BTC, and small holders with less than 1 BTC have steadily added to their positions. .
Bitcoin Trend Accumulation Chart by Cohort | Glassnode
This behavior shows that both large and retail investors used the dip to accumulate more Bitcoin. Still, Glassnode reminded investors that this trend comes from a 15-day moving average, so it may not fully capture the latest changes in the market.
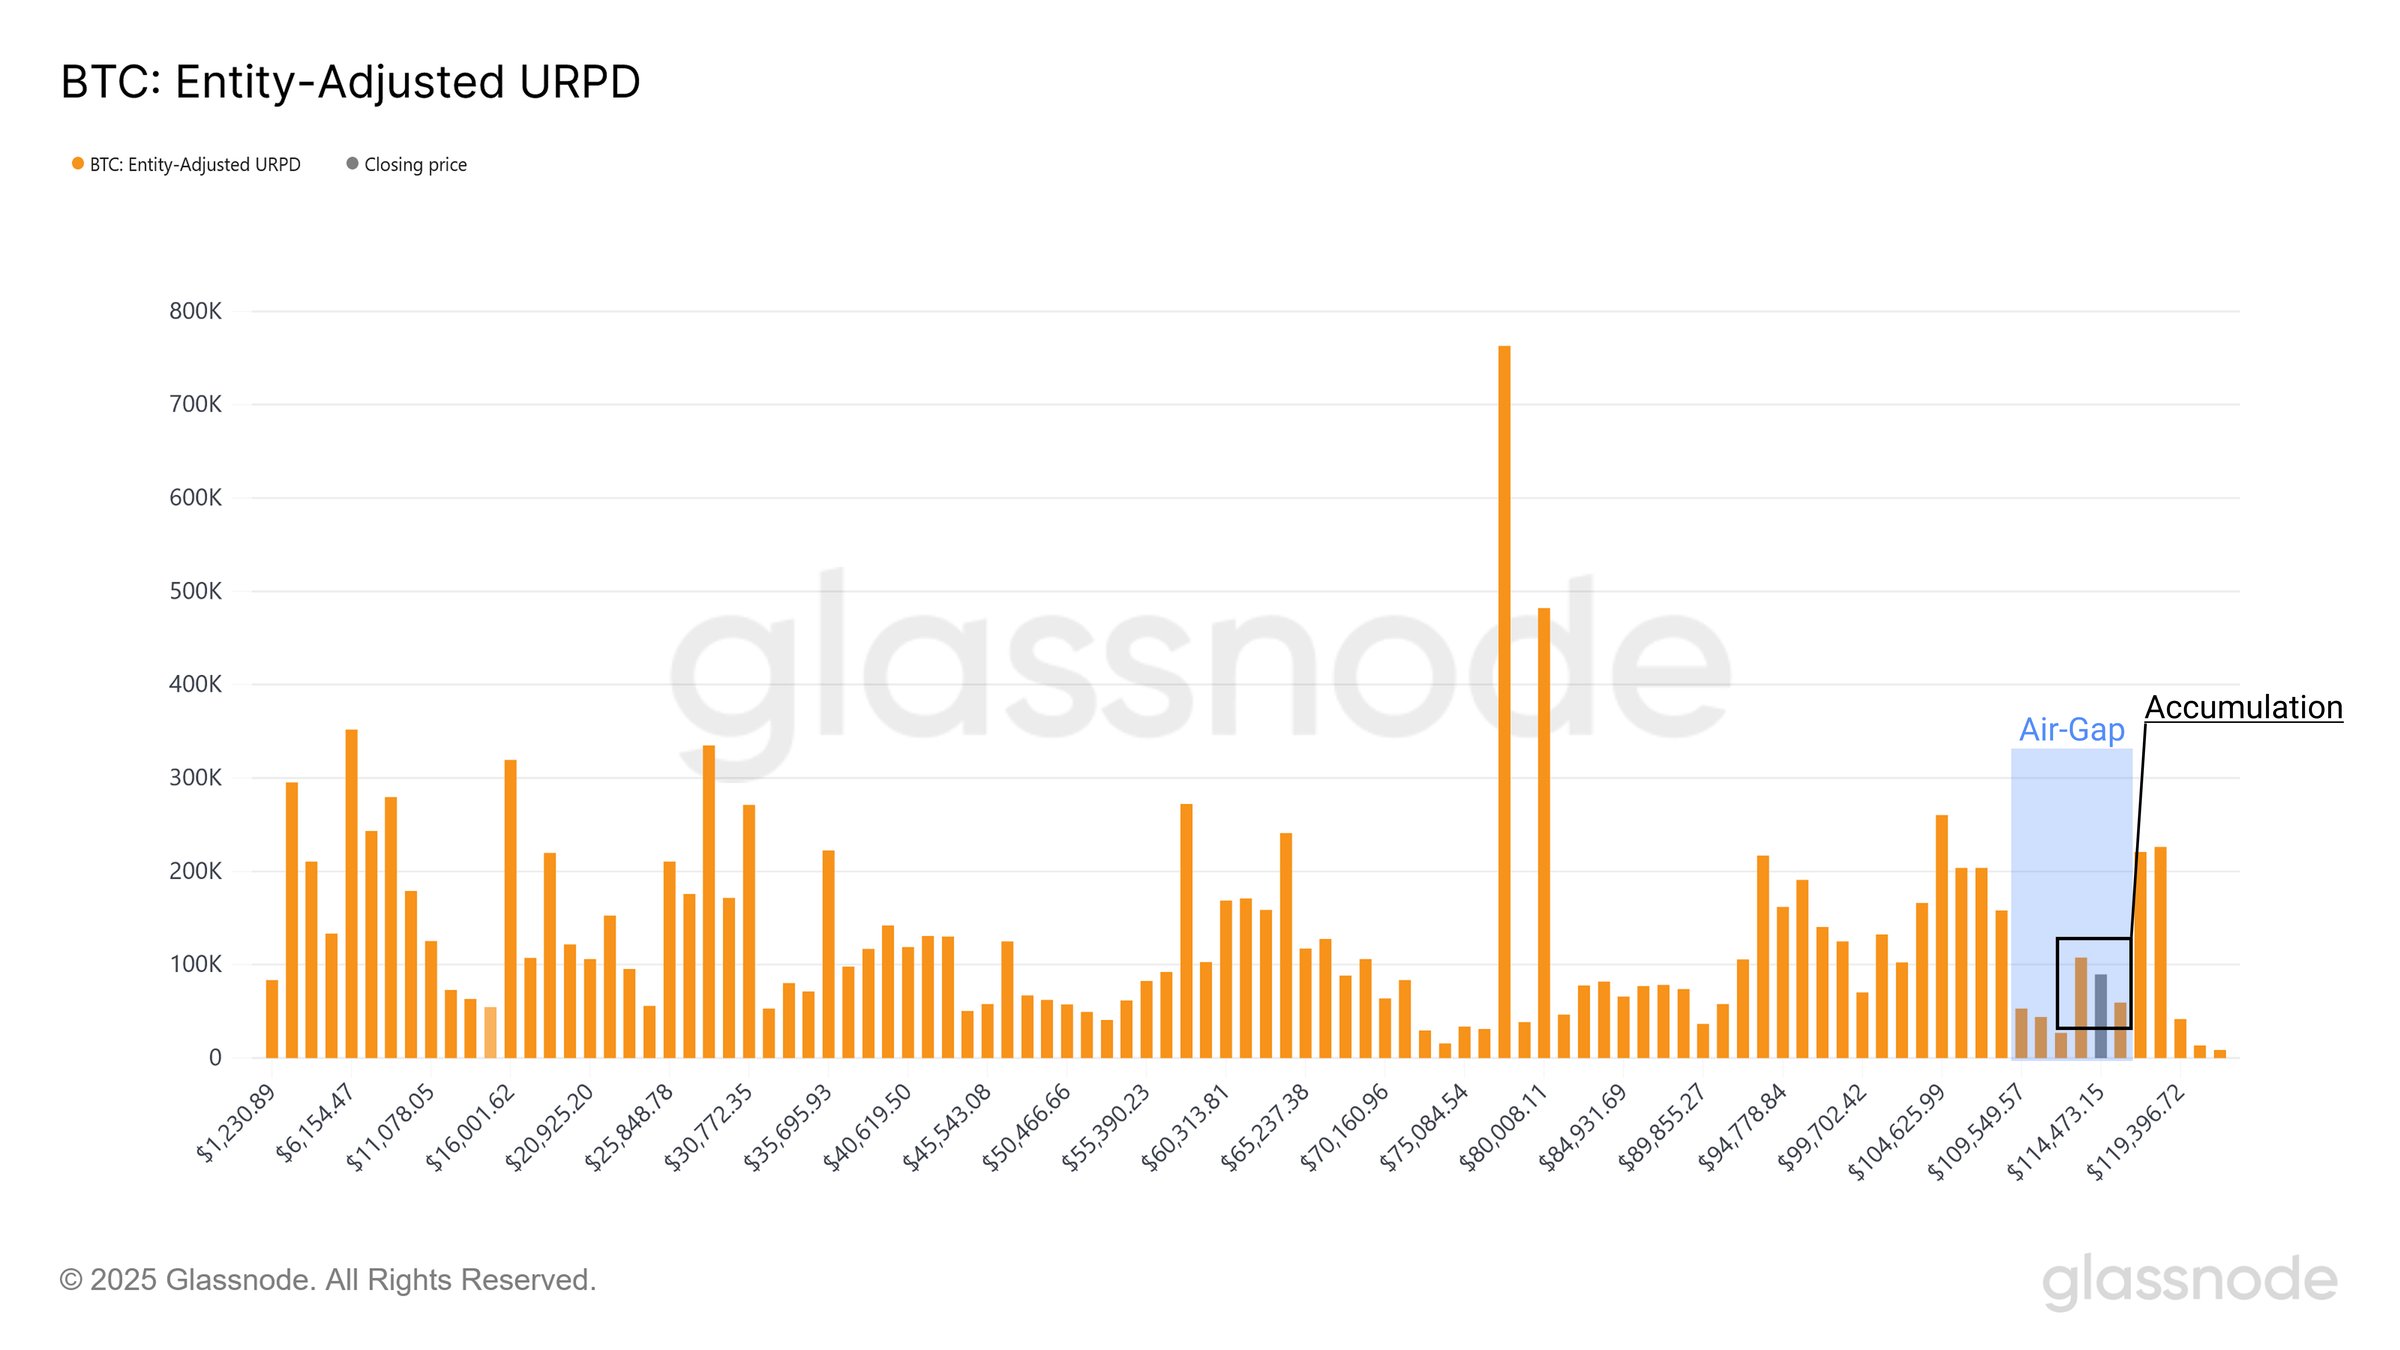
Glassnode also revealed that buyers picked up about 120,000 BTC during the recovery from $112,000 to $114,000. This shows clear interest at those levels. However, Bitcoin's supply between $110,000 and $116,000 remains thin, so the market needs more consistent buying in that range to build solid support.
Bitcoin URPD | Glassnode
Further, Swissblock, another market research firm, confirmed that the market remains strong. It described the correction as a necessary pause, not a sign of deeper weakness.
https://twitter.com/swissblock__/status/1952814097617305723
The firm noted that Net Realized Profit and Loss has dropped sharply, while selling pressure remains low. It also pointed out that SOPR continues to drift lower, not collapse. This suggests people are locking in gains without panic selling. According to Swissblock, investors still aim to sell at higher prices, which shows confidence in the broader uptrend.


 Manage all your crypto, NFT and DeFi from one place


