
Crypto News Today: Bitcoin Back Above $64,000 as ETFs Bleed

0
0

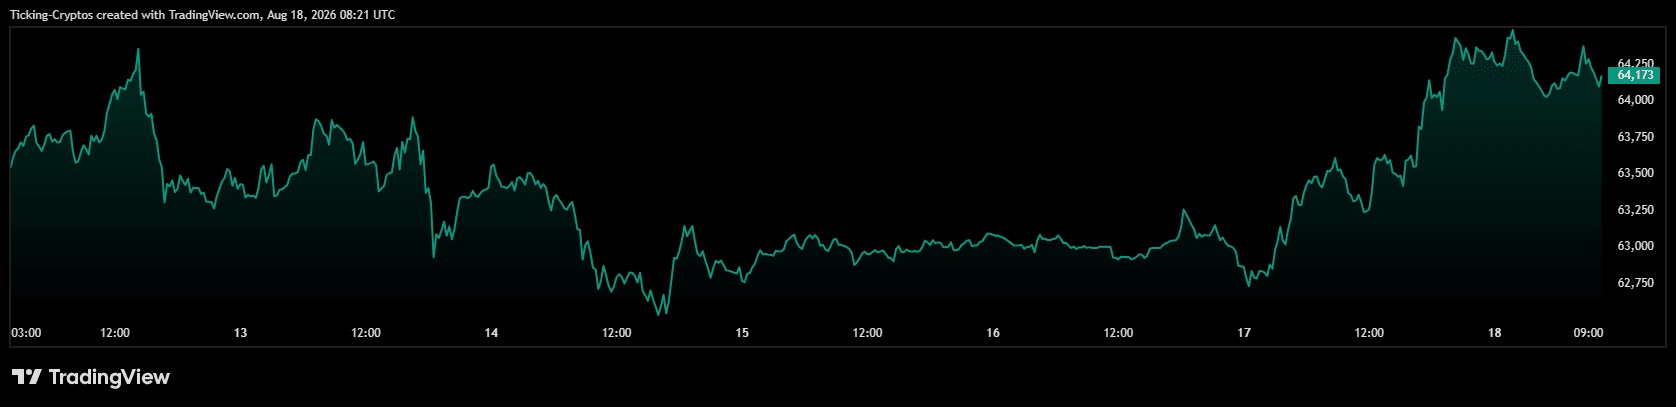
Bitcoin has clawed its way back above $64,000 on Tuesday morning after slipping under $63,000 at the start of the week, but the rest of the market is not following it. XRP and BNB are both lower on the day, Bitcoin dominance has climbed to 58.8%, and the flows underneath tell a more cautious story: spot Bitcoin ETFs pulled in outflows last week, Korea's biggest exchange just reported a revenue collapse, and Washington's crypto market structure bill looks further away than it did in May. Here is what matters this morning.
What are crypto prices doing today?
The market is mixed rather than uniformly higher this morning: Bitcoin is holding a 1.2% daily gain near $64,139 while XRP and BNB are in the red, and Bitcoin dominance has pushed up to 58.8%.
🟠 Bitcoin (BTC) | $64,138.97 | +1.24% (24h) | $1.28 trillion cap
🔵 Ethereum (ETH) | $1,897.15 | +0.18% (24h) | $228.95 billion cap
🟡 BNB (BNB) | $601.99 | -0.30% (24h) | $80.16 billion cap
⚪ XRP (XRP) | $0.9931 | -0.72% (24h) | $62.24 billion cap
🟣 Solana (SOL) | $75.84 | +0.48% (24h) | $44.20 billion cap
🔴 TRON (TRX) | $0.3328 | +0.10% (24h) | $31.59 billion cap
🧭 BTC dominance | 58.8%
😨 Fear and Greed Index | 40 out of 100
Rising dominance at 58.8% while altcoins lag is the tell. Capital that is still in the market is concentrating in Bitcoin rather than rotating down the risk curve, which is normal behaviour late in a drawdown and the opposite of what an altcoin season looks like.
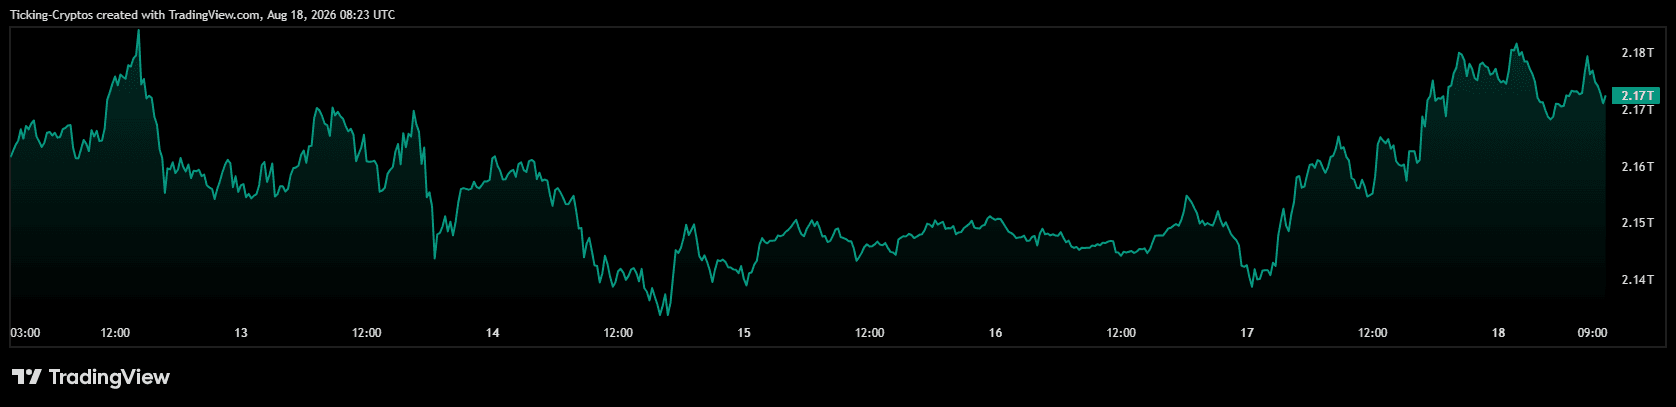
The year to date column is the more sobering read. $Bitcoin is down 26.71% in 2026, $Ethereum is down 36.06%, Solana is down 39.07% and XRP is down 46.02%. Solana's twelve month high of $253.21 was reached back on 18 September 2025, which puts the current bounce in perspective. This is a market grinding sideways at heavily discounted levels, not one breaking out.
Sentiment gauges back that up. The Fear and Greed Index reads 40 out of 100, sitting on the border between fear and neutral, while the Altcoin Season Index has recovered to around 46 out of 100. Cautious, not capitulating.
Why is Bitcoin struggling to break $65,000?
Bitcoin is capped by a well defined supply zone between $65,000 and $65,600, and it has failed to close decisively above that region on every attempt this month.
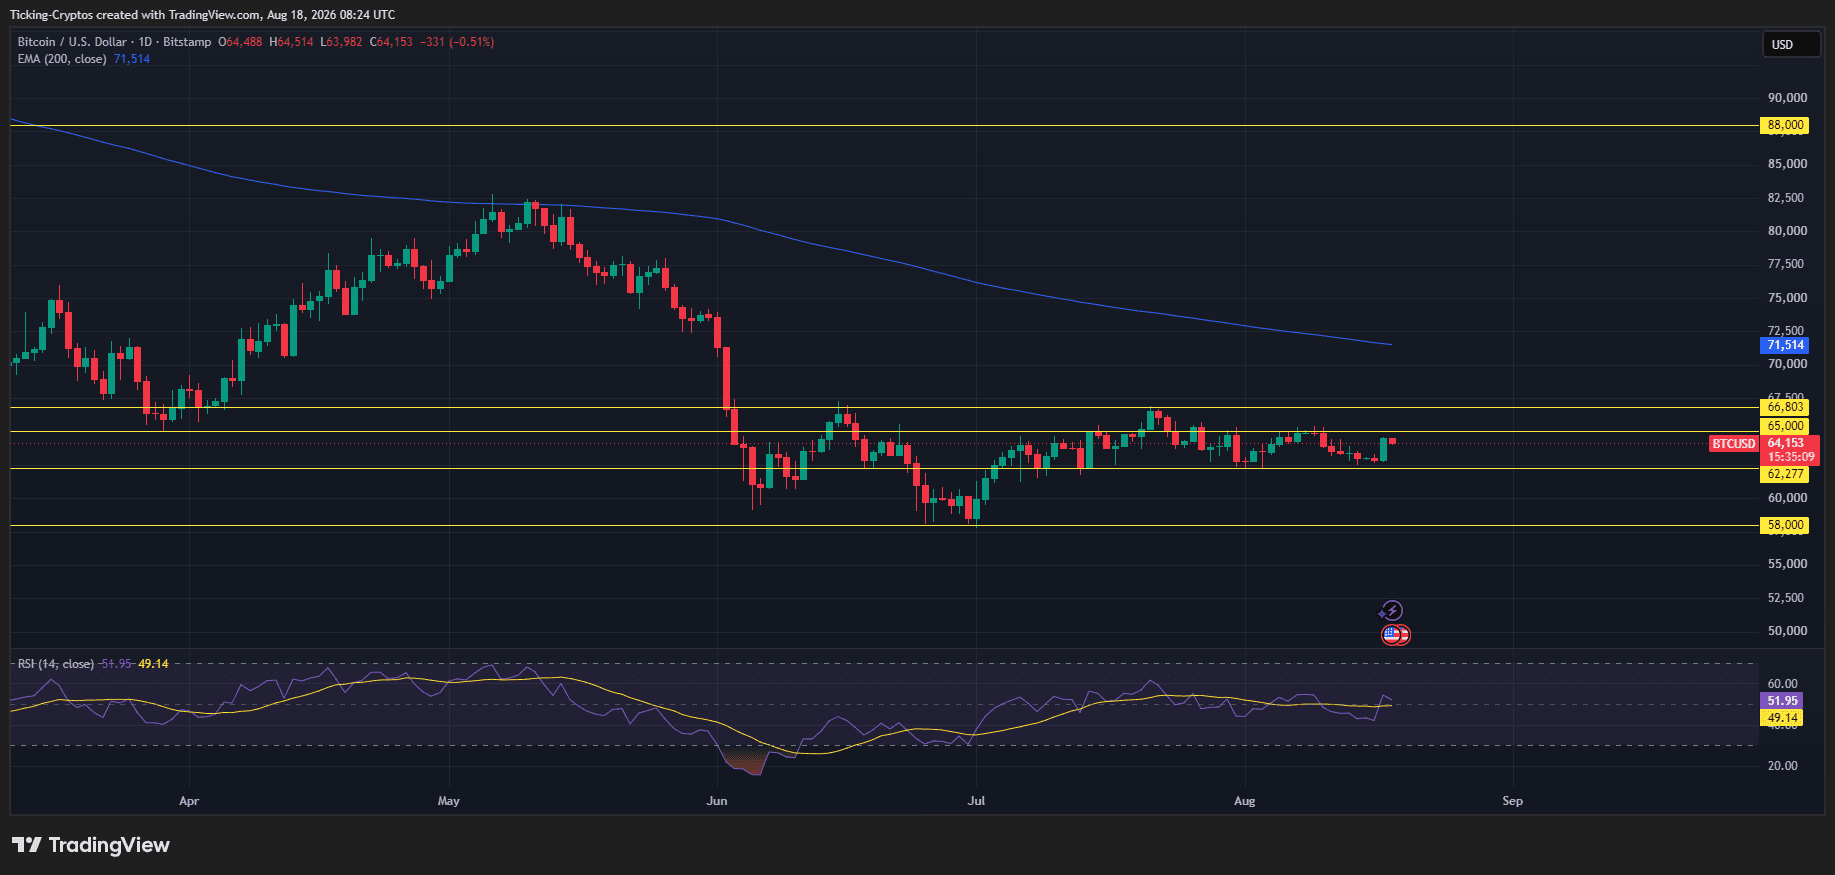
Buyers pushed BTC back above $64,000 on 18 August after the recovery followed a dip under $63,000, but the move remains fragile with resistance stacked at $65,000 to $65,600. On the downside, $63,000 has become the important short term area, and a sustained loss of that level would bring lower supports back into focus.
Traders are also watching leverage. Roughly 66.9% of Binance accounts are positioned long with modest funding rates, which creates long squeeze risk if the $62,300 support gives way. That is the kind of positioning that turns a routine dip into a fast one.
How bad are the Bitcoin ETF outflows?
Spot Bitcoin ETFs recorded more than $385 million in net outflows last week, reversing a much stronger start to August and removing one of the market's most reliable sources of spot demand.
The withdrawals followed a stronger period of ETF demand earlier in the month, and continued outflows could limit Bitcoin's ability to sustain a major upside move. The daily numbers show how choppy the picture has become: US spot Bitcoin ETFs saw roughly $57.63 million leave on 15 August for a third consecutive day of withdrawals, against $521.5 million of inflows earlier in August.
There is a counterweight worth noting. SEC 13F filings show Jane Street accumulated $630 million in Bitcoin ETFs during Q2 2026, taking its total to around $1.06 billion, although the firm's authorised participant role means those holdings reflect ETF creation mechanics rather than a directional bet. One quarter earlier, Jane Street had cut its total Bitcoin ETF holdings by 71%. Read institutional 13F headlines carefully.
Want to build a spot position without leverage? Bitpanda is MiCA licensed in the EU and lets you buy BTC and ETH directly. Open a Bitpanda account here and use code CRYPTOTICKER at signup.
What is the biggest Ethereum story today?
Bitmine now holds 5.82 million ETH, equal to about 4.8% of Ethereum's circulating supply, putting Tom Lee's treasury company within touching distance of its 5% accumulation target.
As of 16 August, Bitmine reported crypto, cash and strategic stakes totalling $11.4 billion, including 5,815,164 ETH valued at a reference price of $1,893 per token, against an ETH supply of 120.7 million. The company bought a further 9,926 ETH last week, extending a weekly buying streak that started in June 2025.
The staking side is where the model gets interesting. More than 5 million ETH is staked, and on a seven day yield of 2.61% Bitmine projects annualised staking rewards of roughly $287 million. Bitmine also repurchased 1.7 million shares last week, taking cumulative buybacks to 20.8 million shares since July under a $4 billion programme.
Lee is leaning on a ratio call to justify the accumulation. He pointed to the ETH/BTC ratio at 0.02994 and rising, arguing it has broken above the long term downtrend and signals that markets are starting to price in tokenisation and agentic AI applications.
Institutional yield is arriving on the ETF side too. Fidelity has filed to add staking and quarterly cash payouts to its $898 million Fidelity Ethereum Fund, which could stake as much as 100% of its ether, with the fund keeping 85% of gross staking rewards and the remaining 15% going to the sponsor, custodians and node operators. The proposal is not yet effective and Fidelity cannot begin staking until the SEC declares the amended registration statement effective.
Is the CLARITY Act still on track?
No. Galaxy Research now puts the odds of the CLARITY Act becoming law in 2026 at roughly 10%, down from 75% in May, with the decisive Senate cloture vote pushed to 15 September.
Galaxy's head of research Alex Thorn cut his probability estimate to about 10% on 14 August, a steep drop from May, and prediction markets are pricing the odds near 17%. The bill's fate now depends on a cloture vote scheduled for 15 September once the Senate returns from recess, and market watchers are already braced for another delay.
This matters more for positioning than for price today. Shifts in expectations around crypto legislation tend to ripple through institutional allocation well before any formal vote, because large allocators wait for regulatory certainty before committing fresh capital.
What does Korea's exchange slump tell us about demand?
Upbit operator Dunamu posted a 49% revenue drop and a 80% collapse in operating profit for the first half of 2026, signalling a structural decline in Korean retail crypto activity rather than a one off soft quarter.
Dunamu reported revenue of 408.1 billion Korean won, around $275 million, down 49.1% year on year, while operating profit fell 79.7% to 111.5 billion won or roughly $75 million. Dunamu attributed the decline to reduced global digital asset liquidity, with the KOSPI more than doubling in the first half of 2026 pulling retail capital out of crypto and into equities.
Bithumb reported a parallel revenue decline of roughly 50% over the same period, which makes this a market wide contraction rather than an Upbit specific problem. Korean retail has historically been a meaningful marginal buyer of Bitcoin, so this is a genuine demand headwind.
Exchange consolidation continues elsewhere as well. BitMEX stops allowing new positions from 26 August and ceases operations entirely at 04:00 UTC on 23 September 2026, with users warned that balances left after closure attract a $50 monthly fee or a 1% annual charge. If you still have funds there, move them this month.
What should traders watch for the rest of the week?
The three levels that matter are $65,000 to $65,600 on the upside, $63,000 as immediate support and $62,300 as the liquidation trigger below it.
A daily close above $65,600 would be the first real technical evidence that the August downtrend has broken. Failing that, the more likely scenario is continued range trading while ETF flows decide the direction. $66,000 is the realistic upside target if a breakout is confirmed.
Corporate treasury behaviour is the wildcard. Both MARA and Strategy have been net sellers this year, and any fresh disclosure of treasury liquidation tends to land badly on a market this thin.
0
0


 Manage all your crypto, NFT and DeFi from one place
Securely connect the portfolio you’re using to start.


0
0

0
0