
Bitcoin Price Analysis: Can BTC Hold the $59K Support?

0
0

Bitcoin is trading near $64,000 after rebounding from a July low below $58,000, yet the recovery remains fragile. The market has regained ground, but it has not repaired the damage caused by heavy selling and uneven institutional demand. This Bitcoin price analysis explains why $59,000 may separate a steady recovery from another difficult decline.
Bitcoin Price Analysis Centers on $59,000 Support
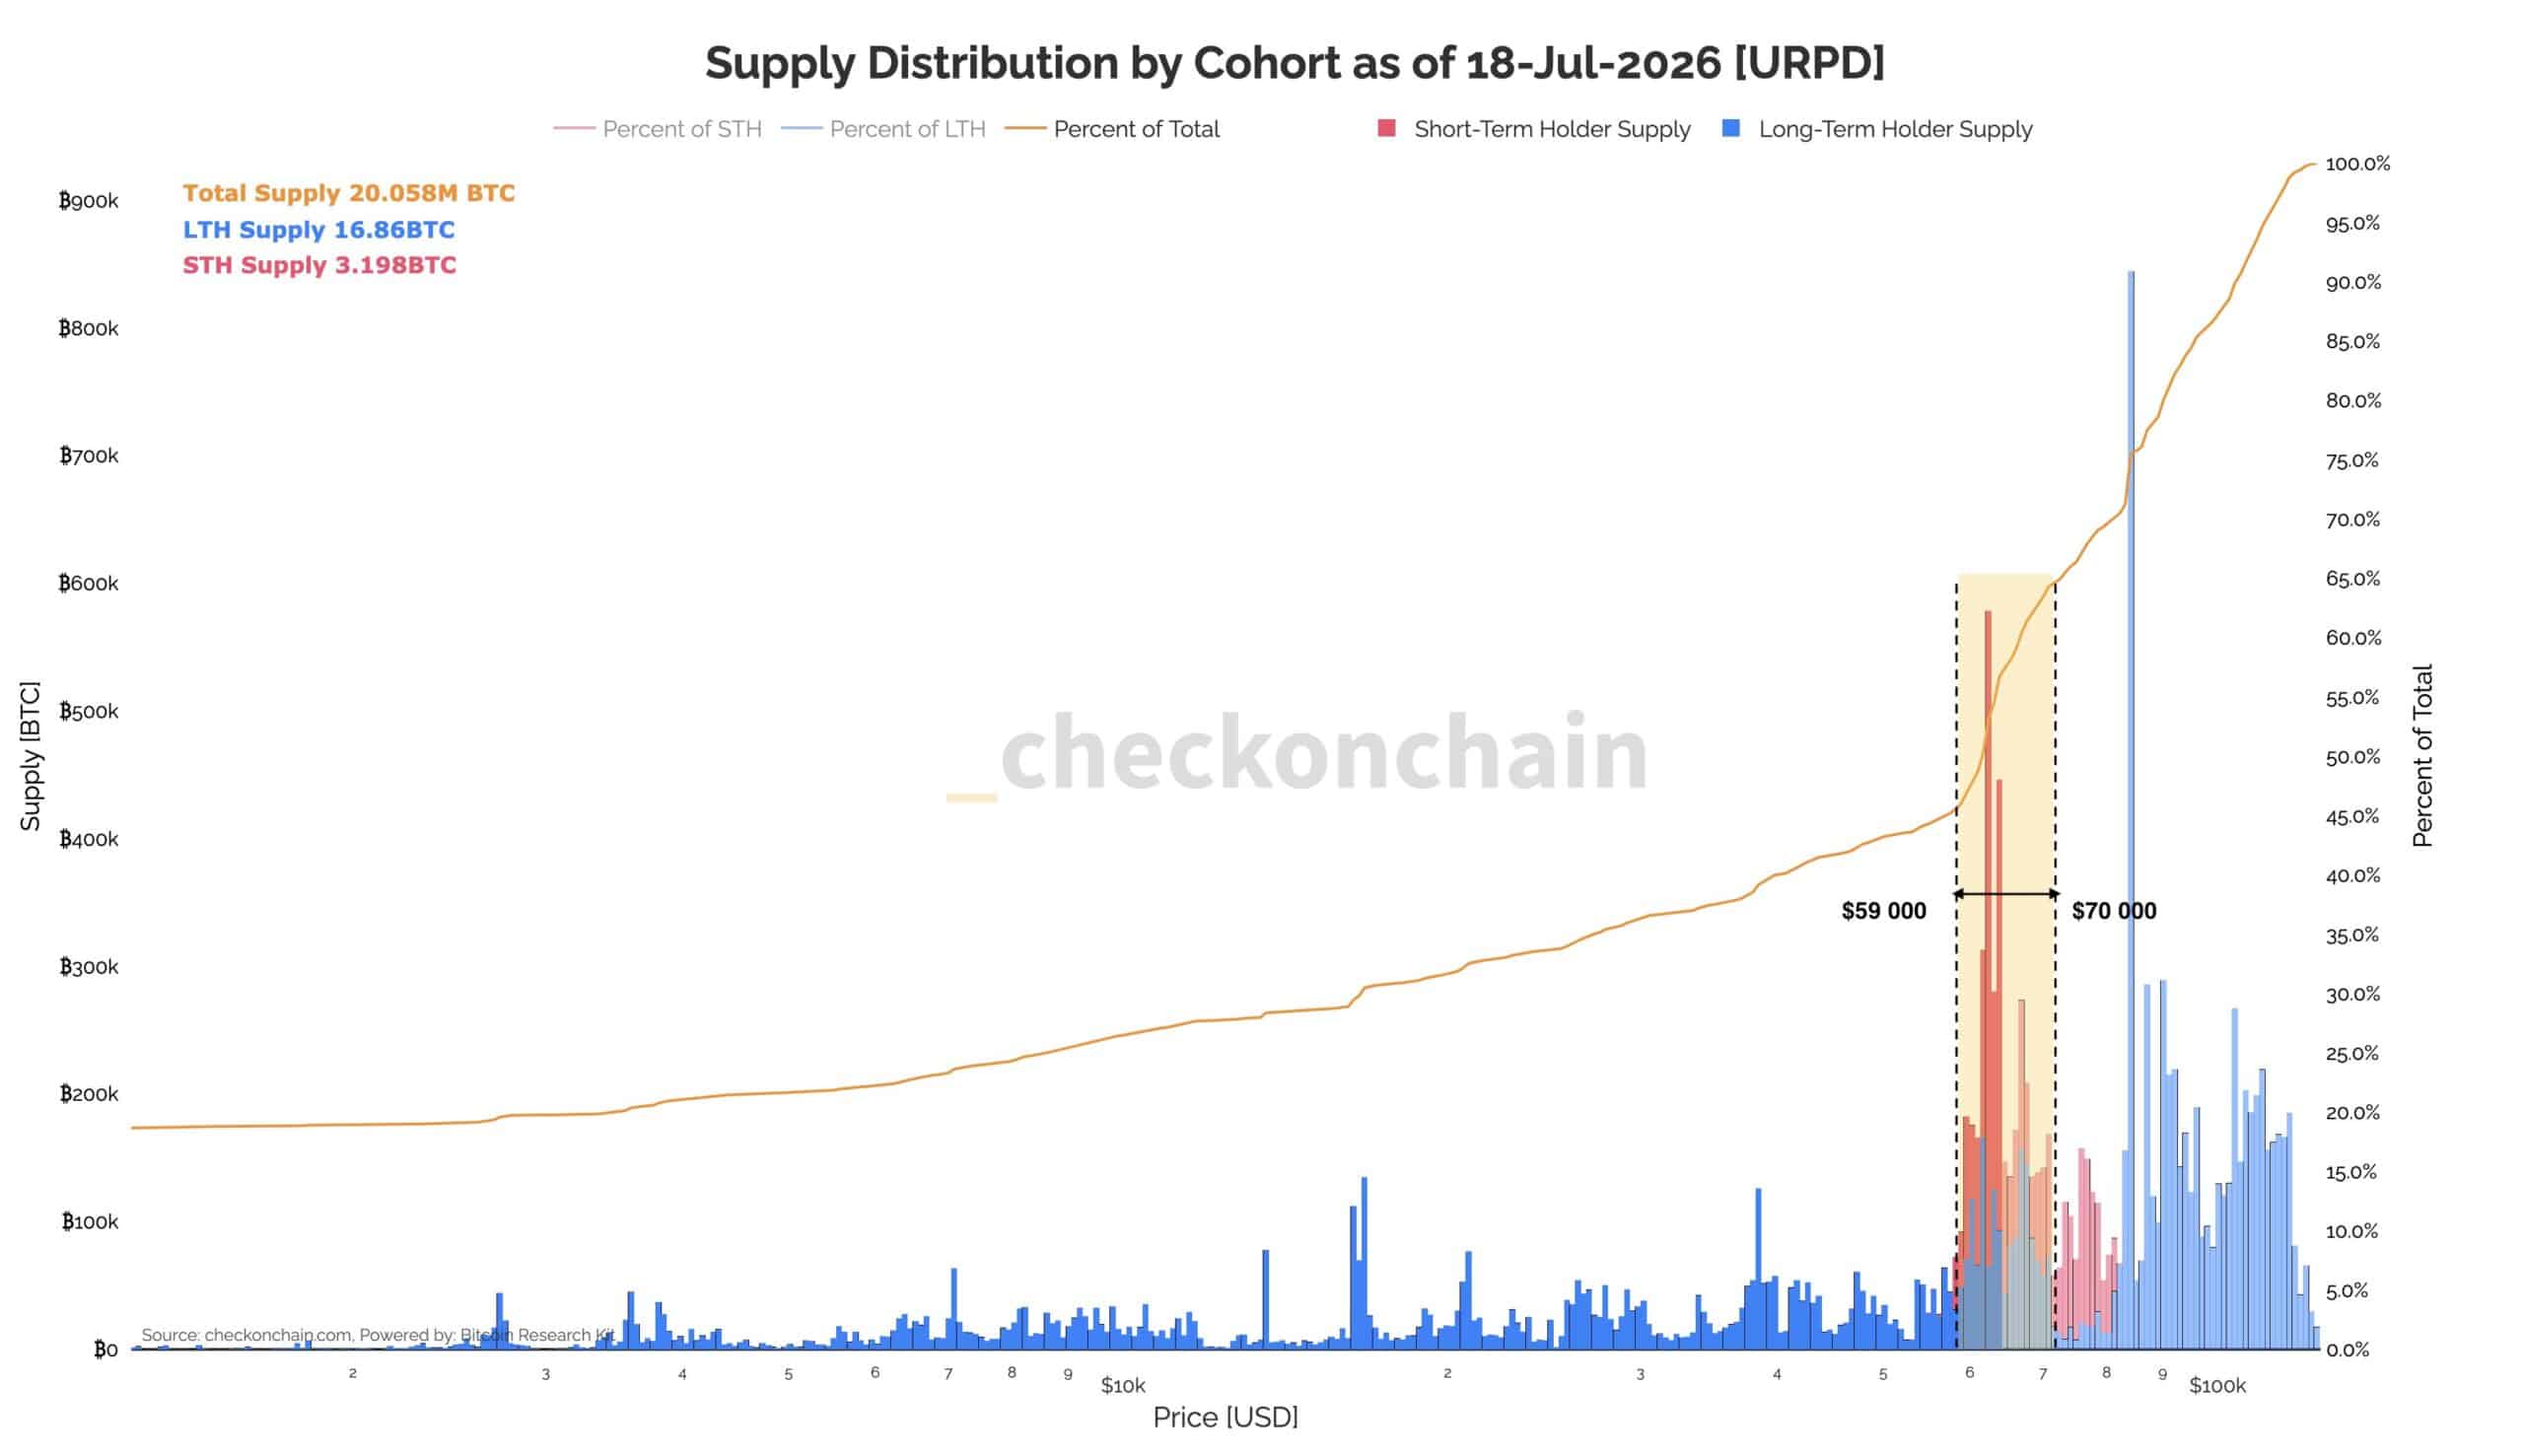
The $59,000 region matters because many holders acquired BTC close to that level. When price returns to a crowded cost basis, behavior often changes. Some investors defend their entry, while others sell quickly to avoid deeper losses.
Bitcoin traded near $58,864 on July 1 before recovering toward $64,000. Recent data placed BTC around $64,400, leaving it above support but below the area needed to restore stronger bullish confidence.
In practical terms, $59,000 works like a pressure valve as a successful defense could attract buyers. A clean breakdown could expose $57,800, followed by the broader $53,000 to $55,000 region.
Holder Behavior Shows an Uneven Recovery
This Bitcoin price analysis also depends on short-term and long-term holders. Recent buyers usually react faster to volatility and are more likely to sell during sudden drops.
Long-term holders often behave differently. When older coins remain inactive, experienced investors are not rushing for the exit. Reduced movement can ease selling pressure, though it cannot create demand by itself.
Binary Coin Days Destroyed tracks whether older coins are moving. A low reading suggests limited spending by long-held supply. That is constructive because rallies have more room when established holders are not distributing heavily.
SOPR Shows Whether Sellers Accept Losses
Spent Output Profit Ratio, or SOPR, compares the selling value of moved Bitcoin with its value when acquired. A reading above 1 means coins are sold at an average profit. Below 1 means sellers are realizing losses.
The reported combined SOPR near 0.89 suggests continued financial stress. However, a rise toward 1 would show improving conditions. For this Bitcoin price analysis, reclaiming 1 could confirm that forced selling is fading and profitable transactions are returning.
ETF Flows Remain the Missing Fuel
Spot Bitcoin exchange-traded funds give institutions regulated exposure without directly holding BTC. Strong inflows can absorb supply, while persistent outflows add pressure.
July flows have been inconsistent. U.S. spot products recorded a large inflow on July 3, but later sessions included renewed withdrawals. Citi also reduced its 12-month Bitcoin forecast after weak ETF demand and year-to-date outflows hurt its earlier assumptions.
That pattern keeps the Bitcoin price analysis cautious. BTC can rise without ETF support, but a sustained breakout becomes harder when institutional capital remains hesitant.
Bitcoin Price Analysis Table
| Level or indicator | Signal | Meaning |
|---|---|---|
| $59,000 | Critical support | Main holder defense zone |
| $57,800 | Downside level | Recent local low |
| $64,300 to $65,000 | Resistance | Recovery confirmation area |
| SOPR near 0.89 | Below 1 | Sellers realizing losses |
| ETF flows | Mixed | Demand lacks consistency |
| Long-term holders | Limited selling | Lower supply pressure |
What Comes Next for Bitcoin?
A daily close above $65,000 could strengthen the recovery and open a path toward $68,000. Failure to hold $59,000 would weaken the structure and raise the risk of a slide toward $55,000.
The wider Bitcoin price analysis must also consider oil prices, interest-rate expectations, the U.S. dollar, and geopolitical tension. Bitcoin still behaves like a risk asset during periods of fear, so outside markets can disrupt an otherwise healthy setup.
Conclusion
Bitcoin has escaped its early-July low, but it has not cleared its biggest hurdle. The Bitcoin price analysis stays constructive while $59,000 holds, long-term holders remain patient, and SOPR improves. Buyers still need firmer ETF demand and a break above $65,000 before the rebound looks durable.
Frequently Asked Questions
Why is $59,000 important?
It is a major support and holder cost-basis zone.
What does SOPR below 1 mean?
Moved coins are being sold at an average loss.
Can Bitcoin reach $68,000?
It may, but BTC must hold support and clear $65,000.
Glossary of Key Terms
SOPR: An on-chain ratio measuring realized profit or loss.
Support: A price area where buying demand may increase.
Resistance: A level where selling pressure may slow a rally.
ETF flow: Money entering or leaving exchange-traded funds.
Cost basis: The average price paid for an asset.
Sources
Read More: Bitcoin Price Analysis: Can BTC Hold the $59K Support?">Bitcoin Price Analysis: Can BTC Hold the $59K Support?
0
0

 Manage all your crypto, NFT and DeFi from one place
Securely connect the portfolio you’re using to start.


0
0

