Fartcoin (FARTCOIN) Price is At a Crossroads, Will It Break Out or Break Down?

0
0

- Fartcoin is facing bearish pressure on the daily technical charts, dropping 8% in the last 24 hours.
- RSI at 50.22 and MACD near zero suggest market equilibrium before the next major move.
- Investors should watch the $1.30 resistance breakout and the $1.00 psychological support for directional signals.
Fartcoin is facing bearish pressure on the daily technical charts. As per CMC data, it is currently trading at $1.05 with an intraday drop of 8%, showcasing bearishness. It is in a critical bearish phase, which has shaped its recent price movements.
The cryptocurrency has formed a clear price corridor between $1.0077 and $1.6597, which has kept the most trading activity inside it since the big rise in early January 2025. Fartcoin’s price pattern shows a well-known boom-bust cycle that is common in altcoins, reaching a high of around $2.40 and then going into a long period of decline.
FARTCOIN price correction has happened in an orderly way, which suggests that the market is maturing and that accumulation and distribution are taking place. Being at $1.00 means the asset has dropped about 60% from its January peak, which may make it appealing to investors who can tolerate risk.
What’s Next for the Fartcoin Price?
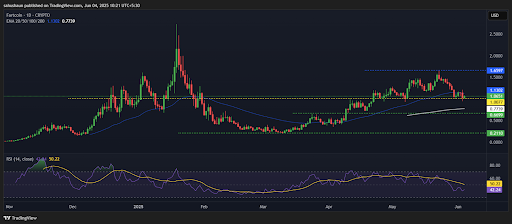
Technical indicators are giving a mixed signal that is becoming more neutral. The RSI at 50.22 is right in the middle, which means that neither buying nor selling pressure is stronger than the other.
Such a neutral RSI reading is often followed by a major shift in the market’s direction as it gathers strength for the next main trend. The MACD is close to the zero line, with little histogram movement, which supports the idea of consolidation and suggests that momentum is currently low.
The price is found below the 50-period EMA. However, the 200-period EMA is still offering strong support. It means that although the market is sideways for now, a recovery could take place if key resistance levels are broken.
Current market uncertainty is visible in social sentiment indicators, which shift between mild pessimism and optimism. Since the sentiment reading is 0.1677, retail interest is not very high, yet it is not entirely negative, so any increase in activity from institutions or whales could push the market further.
The main levels to watch are $1.3092 on the upside and $1.00 on the downside. If the price goes above $1.30, it could encourage a fresh uptrend toward $1.65, while a fall below $1.00 could result in a test of the main support area at $0.62-0.66. It is best to stay patient until the market shows a clear break in one direction.
Highlighted Crypto News Today:
Trump Media Files for Spot Bitcoin ETF, Signaling Major Crypto Push
0
0

 Manage all your crypto, NFT and DeFi from one place
Securely connect the portfolio you’re using to start.