Why is The Crypto Market Down Today?

0
0

Following yesterday’s brief green patch, the crypto market has resumed its muted performance. Total crypto market capitalization (TOTAL) continues to trade sideways, pulling the price of Bitcoin (BTC) down with it. Amid the broad retreat, PUMP stands out as the day’s worst performer.
In the news today:
- The DOJ’s acting Criminal Division chief suggested the Department will not bring similar charges against software developers, indirectly referencing the Roman Storm case. The prosecution drew widespread sympathy, even from within government circles, likely influencing the revised stance.
- Coinbase has announced plans to list USD1, the stablecoin issued by World Liberty Financial. The move follows the minting of over $200 million worth of USD1 yesterday, ensuring liquidity for incoming users.
TOTAL Moves Sideways Between Key Levels
The market’s lackluster performance since the start of the week has left TOTAL moving sideways, struggling to break out in either direction. It has encountered strong resistance around $3.85 trillion while finding support near $3.73 trillion.
This reflects the broad indecision among market participants as buyers and sellers alike wait for a catalyst to define the market’s next move.
The declining Average True Range (ATR) on the daily chart confirms this. The ATR indicator measures market volatility by calculating the average range between daily highs and lows. When ATR climbs, it signals rising volatility, often preceding sharp price swings or trend reversals.
On the other hand, when it falls, it indicates reduced price swings. It signals that the market has entered a consolidation phase where momentum stalls and traders adopt a wait-and-see approach before the next decisive move.
TOTAL’s ATR has gradually declined since August 15, when the market began losing its bullish momentum and slipped into a sideways trend.
If demand soars, TOTAL could attempt to break above the resistance at $3.85 trillion. A successful breach of this barrier could open the door for a rally toward $3.94 trillion.
For token TA and market updates: Want more token insights like this? Sign up for Editor Harsh Notariya’s Daily Crypto Newsletter here.
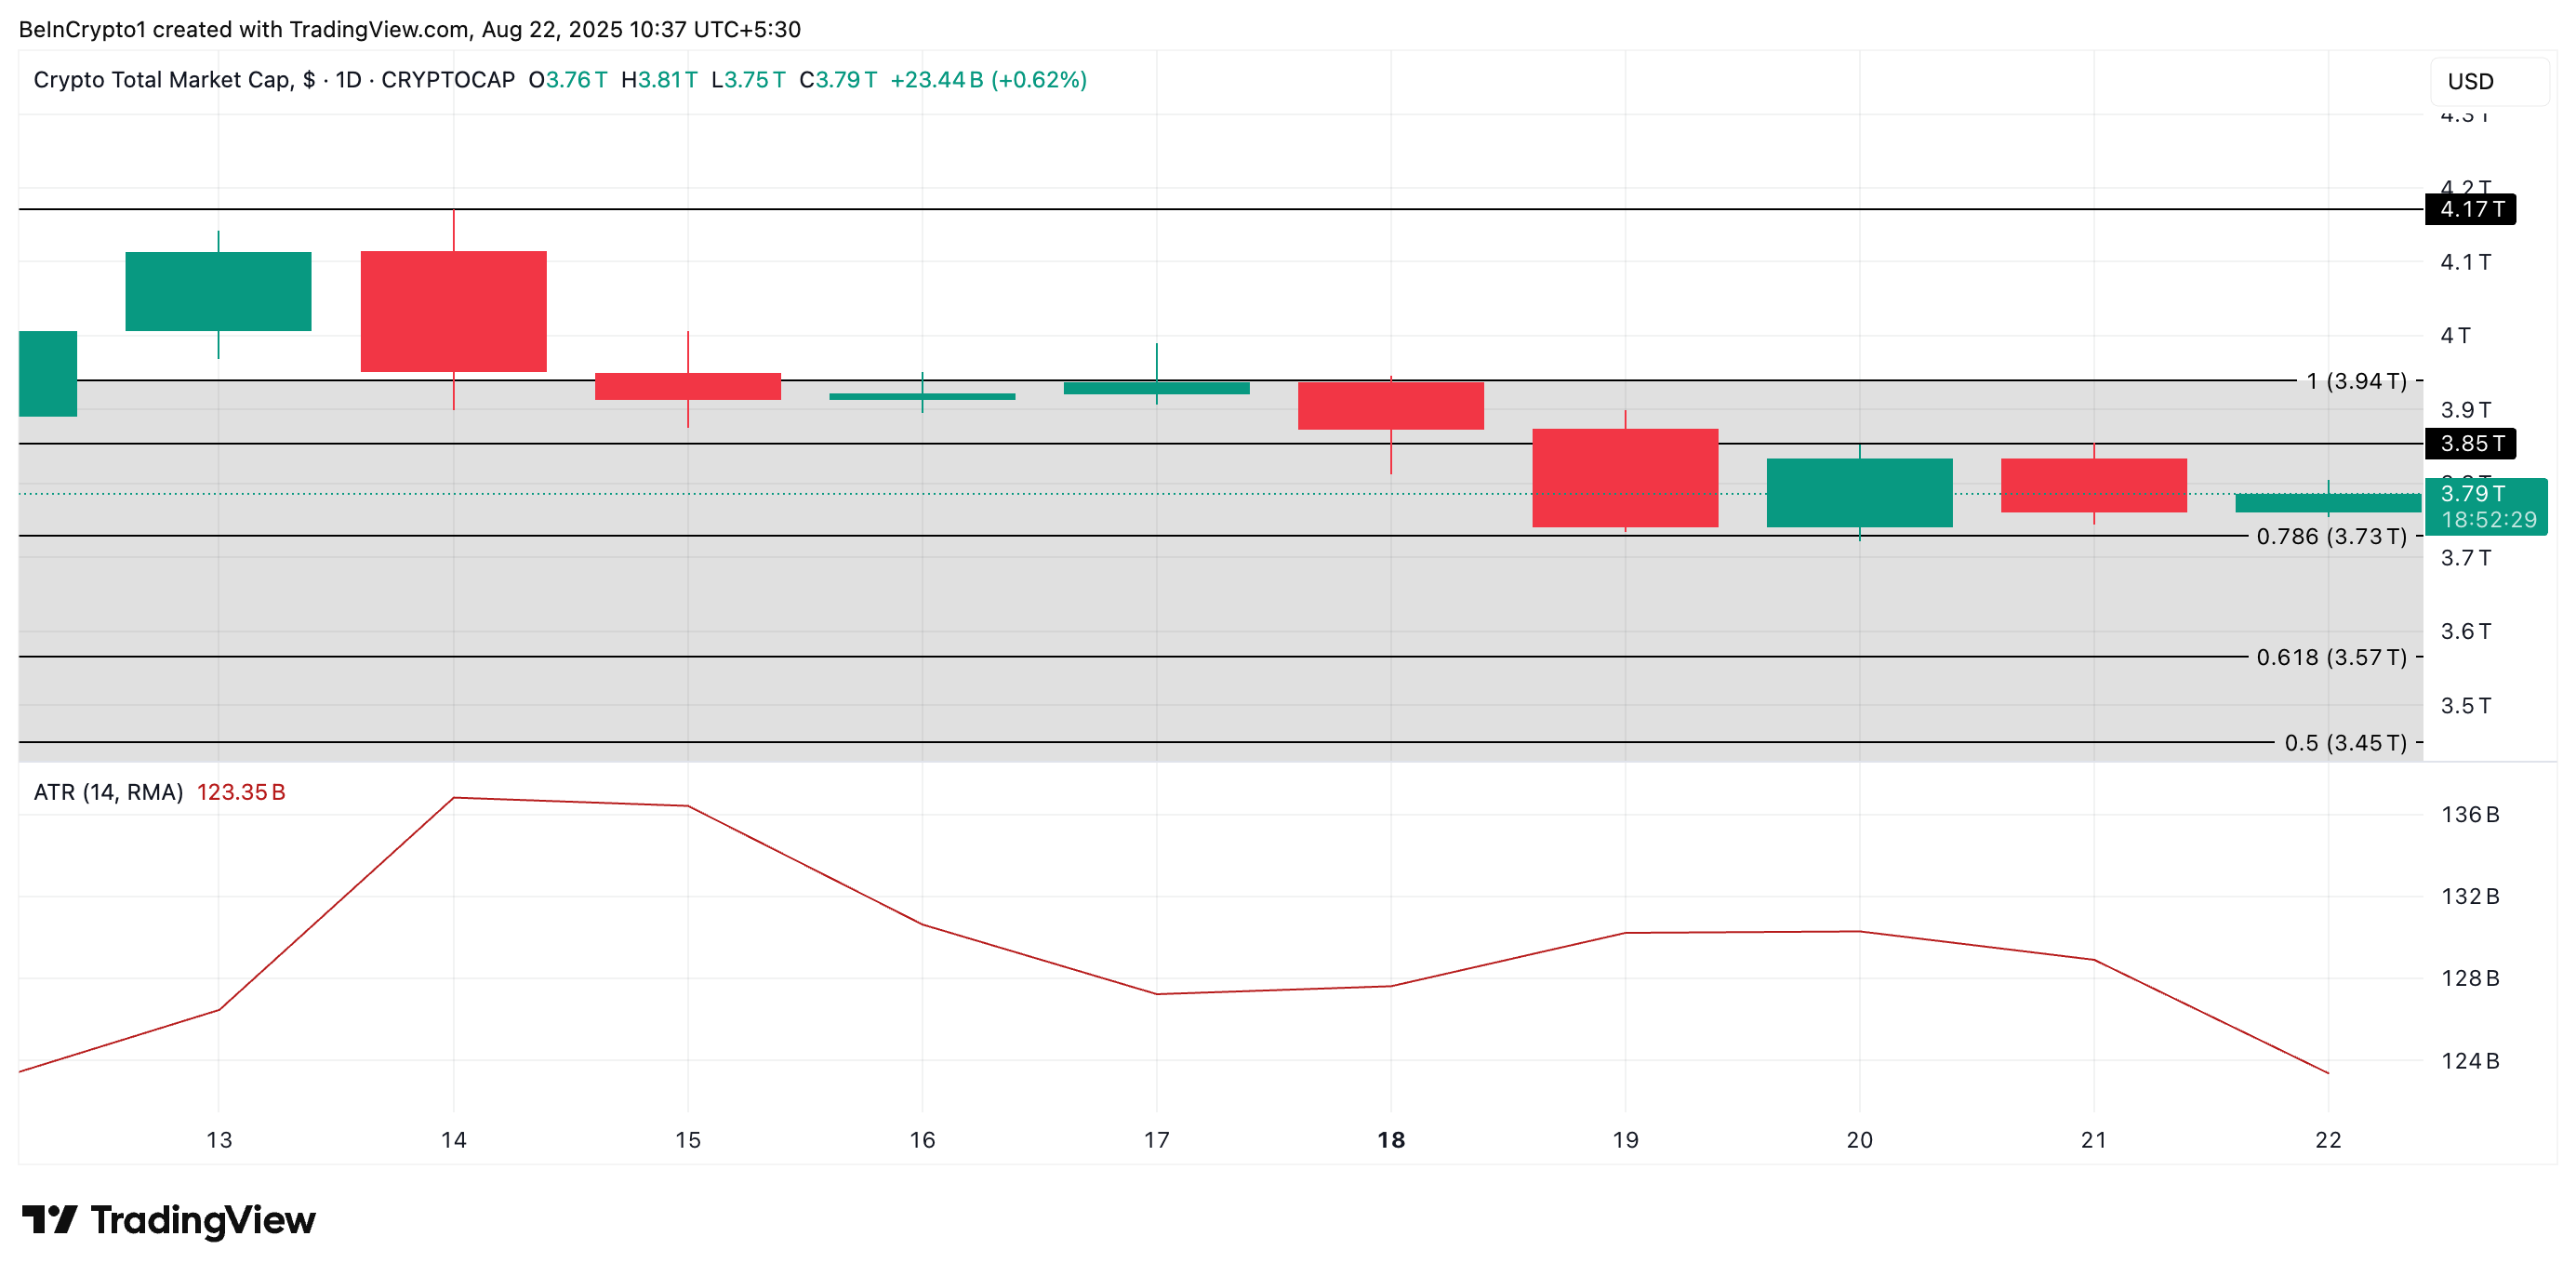 Total Crypto Market Cap Analysis. Source: TradingView
However, if the bears strengthen their control, they could drive a dip below $3.73 trillion and toward $3.57 trillion.
BTC Bears Eye Sub $110,000 as Trading Volume Shrinks
Leading coin BTC trades at $112,976, noting a modest 1% dip over the past 24 hours. During the period in review, the coin’s daily trading volume has also fallen by 11%, confirming the bearish tilt in market sentiment.
When an asset’s price and trading volume decline simultaneously, it reflects weakening investor interest and a lack of strong conviction from either buyers or sellers. This combination signals reduced market participation and can point to fading buy-side pressure in the BTC market.
BTC’s downward trend over the past week has now brought it close to the key support level at $111,961. A breach below this floor could open the way for a deeper correction, potentially sending the price under $110,000.
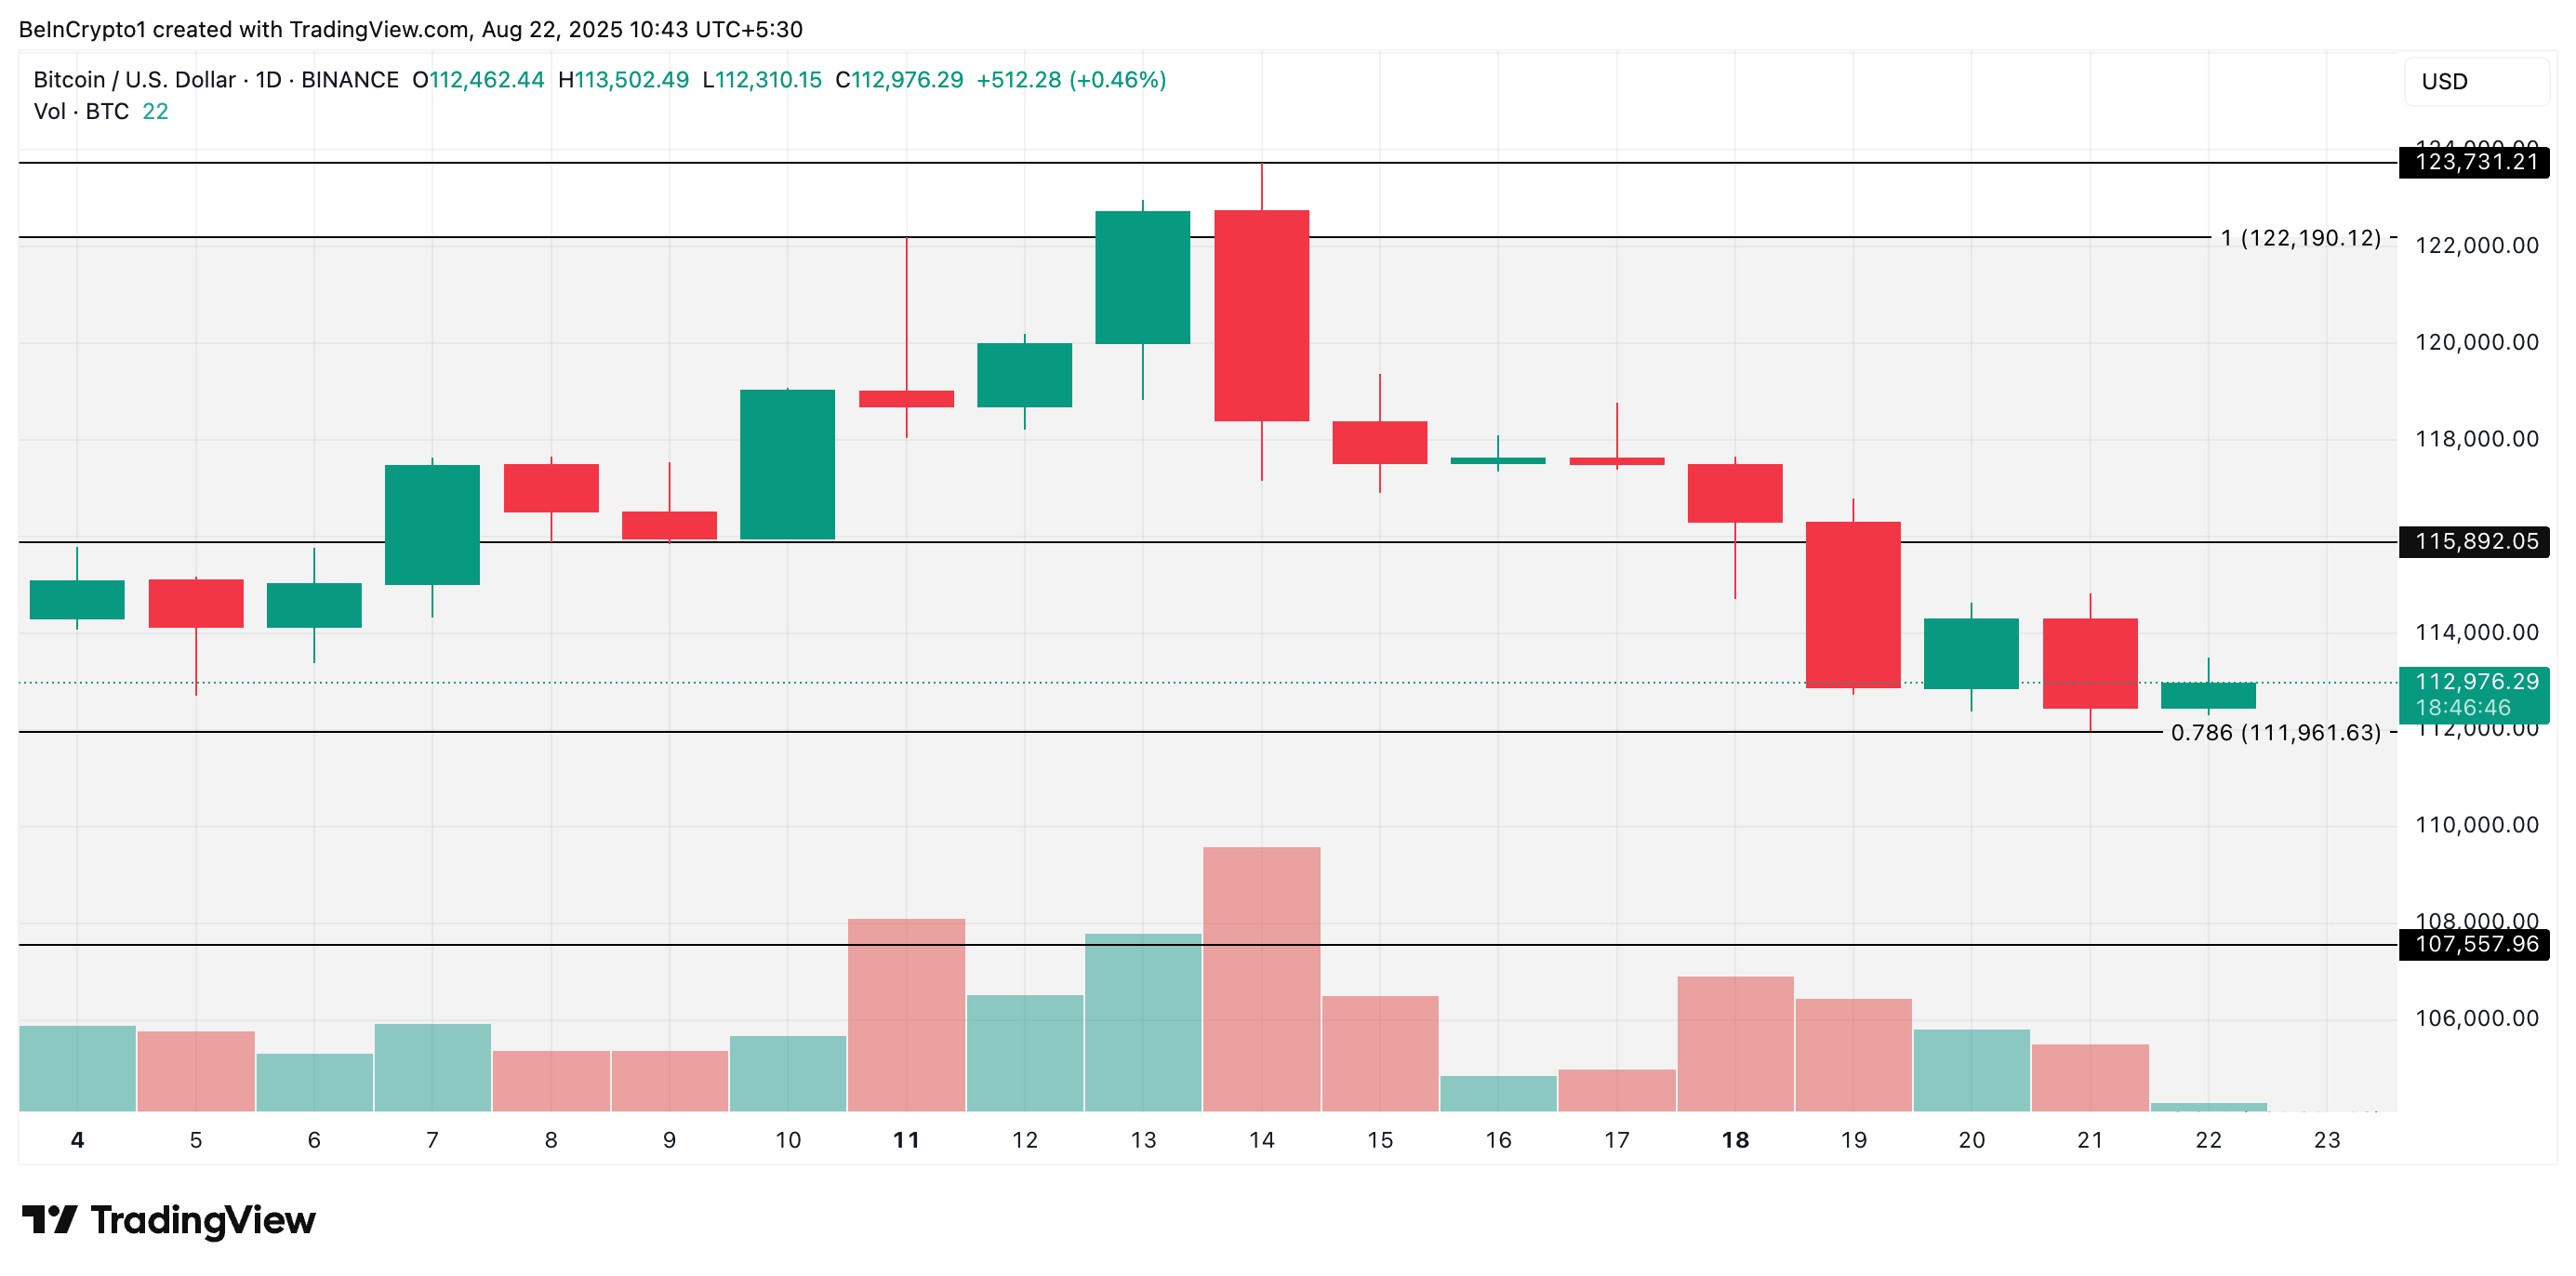 Bitcoin Price Analysis. Source: TradingView
However, if buying activity resumes, the coin could see a rebound toward $115,892, offering bulls a chance to regain control.
PUMP Price Drops, Bears Test Short-Term Support
PUMP, the native coin of Solana-based memecoin launchpad Pump.fun, has noted a 7% price dip today.
Readings from the PUMP/USD one-day chart show the altcoin trading under its 20-day exponential moving average (EMA), which currently forms dynamic resistance at $0.0033. This highlights how significant PUMP selloffs have been over the past few trading sessions.
The 20-day EMA measures an asset’s average price over the past 20 trading days, giving weight to recent prices. When price trades above the 20-day EMA, it signals short-term bullish momentum and suggests buyers are in control.
On the other hand, when an asset’s price breaks below this level, there is increased selling pressure, and short-term support has weakened. This puts PUMP at risk of falling to $0.0022.
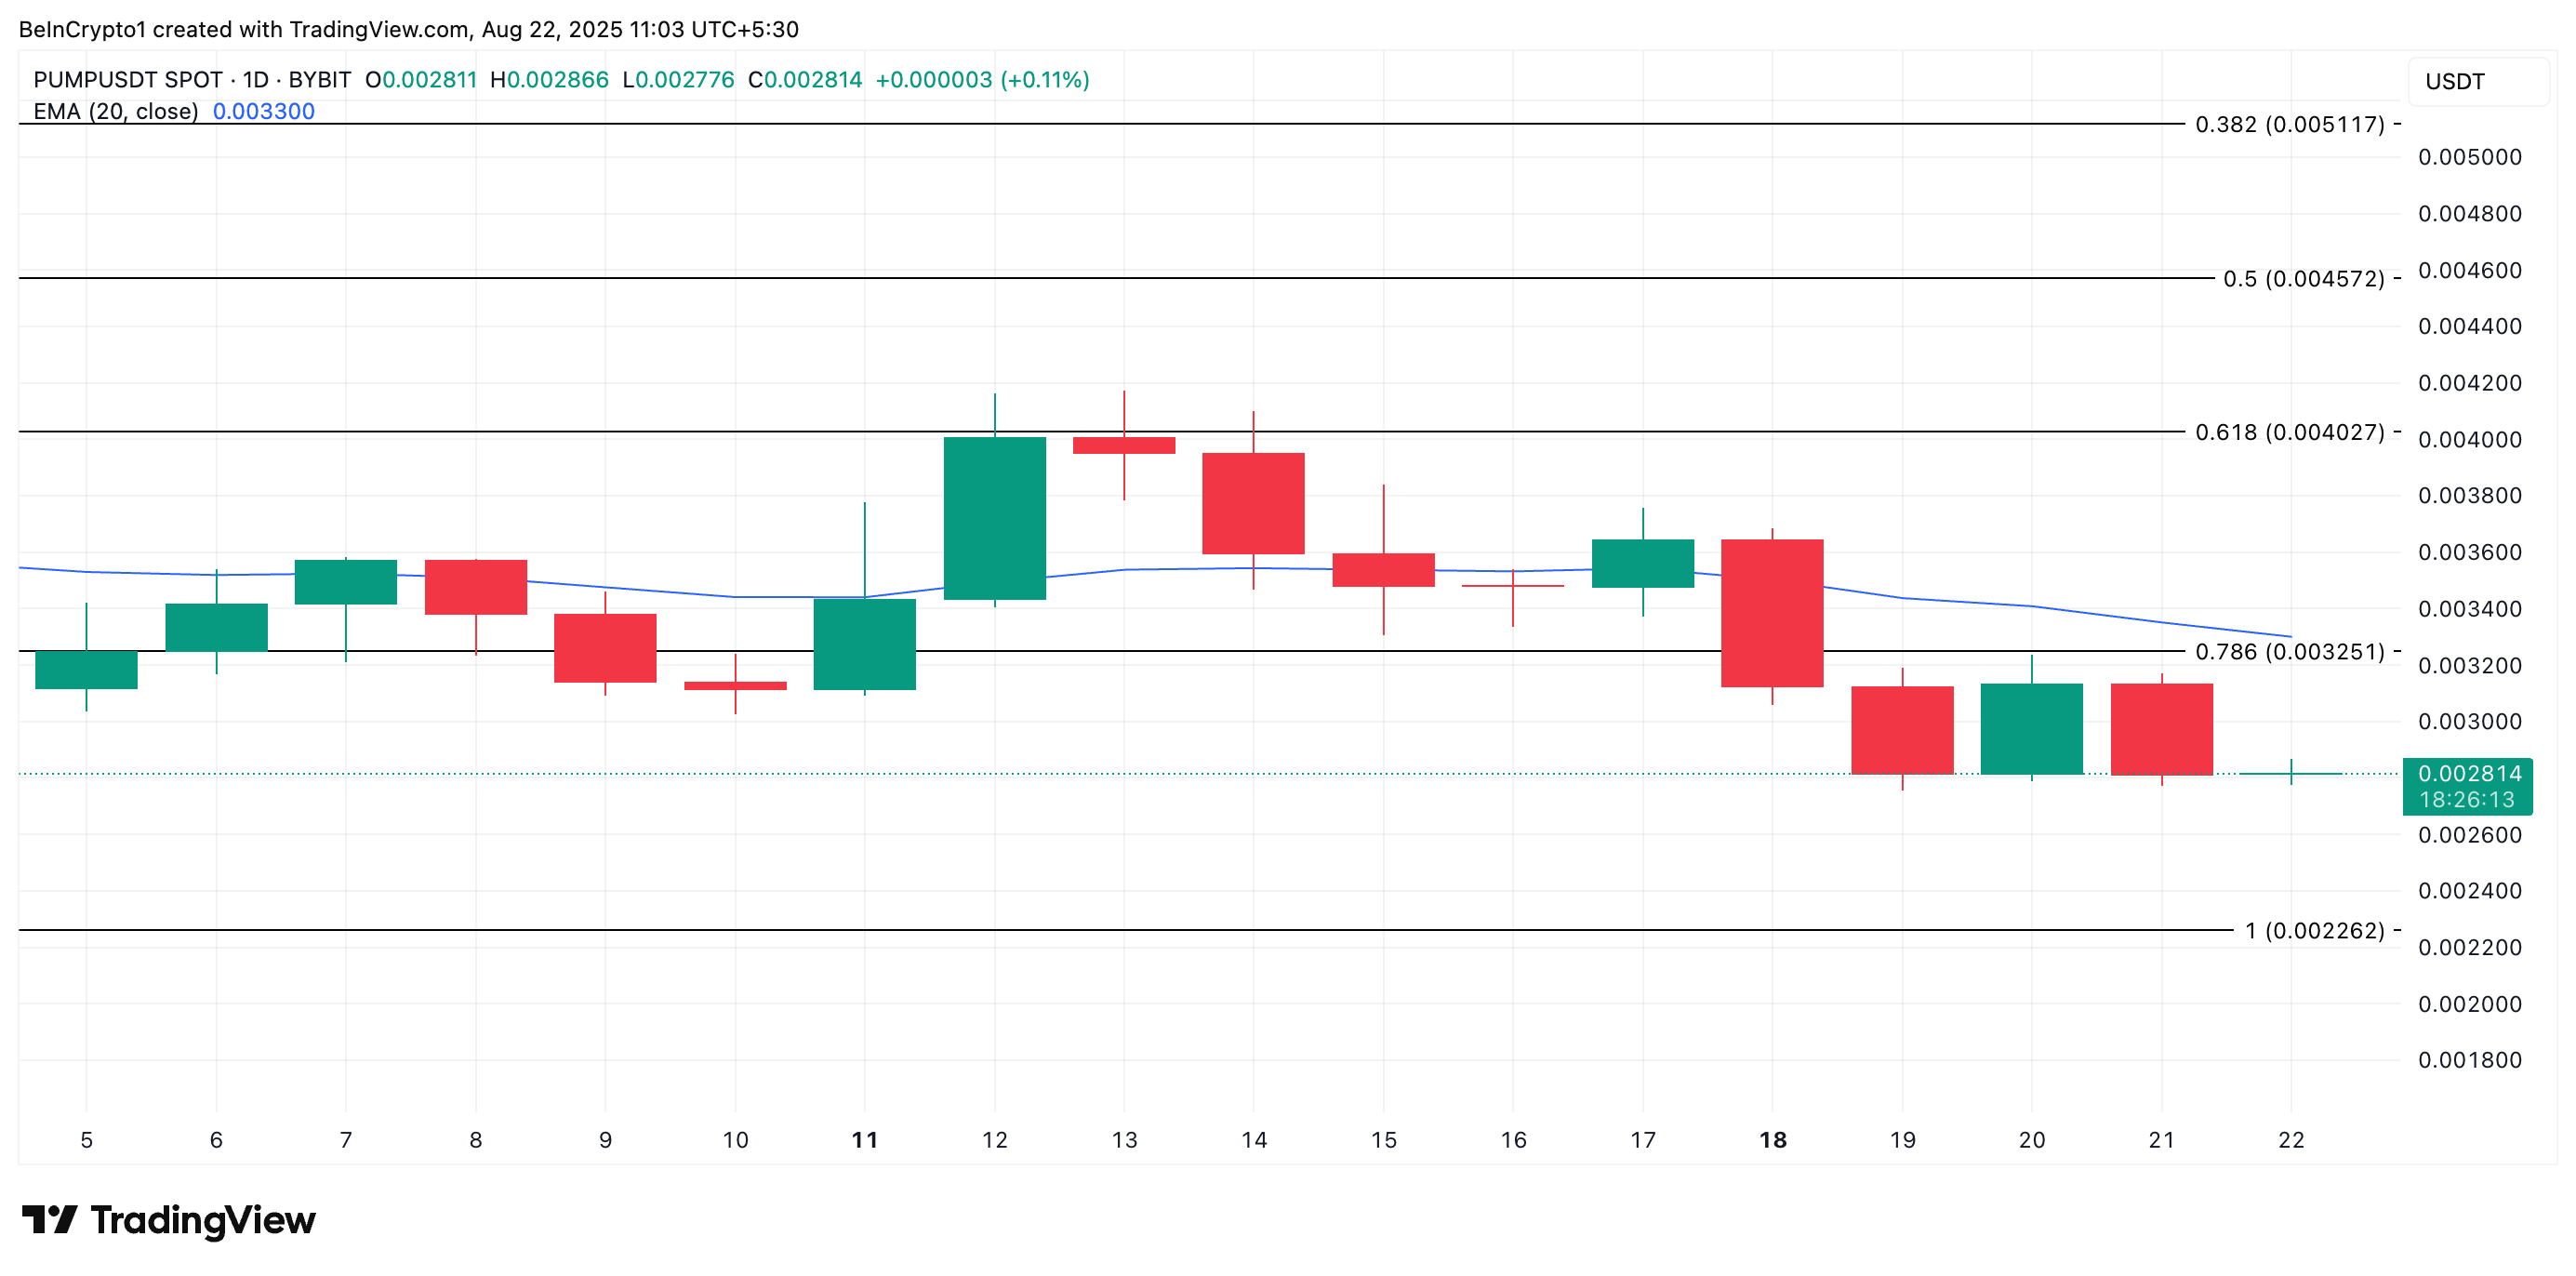 PUMP Price Analysis. Source: TradingView
However, if demand returns to the market, it could push PUMP’s price $0.0032.
0
0


 Manage all your crypto, NFT and DeFi from one place
Securely connect the portfolio you’re using to start.


0
0

