Whale Turns Losses into Gains as Fartcoin Rises 8%

0
0
Coinspeaker
Whale Turns Losses into Gains as Fartcoin Rises 8%
Fartcoin (FARTCOIN) has staged a remarkable rally, climbing nearly 9.76% in the past 24 hours to trade around $0.9090, as of April 21. This jump in price comes in the wake of significant whale activity that not only reversed prior losses but also injected fresh momentum into the market.
Whale’s Redemption Arc
Just three days ago, blockchain analytics firm Lookonchain reported that a whale who previously lost $701,000 on Fartcoin had once again dived into the token, spending 14,725 SOL ($1.98 million) to acquire 2.22 million FARTCOIN at $0.89.
This whale flipped the script — turned losses into gains.
He sold 2.69M $Fartcoin($2.47M) at $0.92 3 hours ago, making a $127K profit.https://t.co/4YOOWwYVoz https://t.co/hFmdUNnS04 pic.twitter.com/OZt2Yp3KDw
— Lookonchain (@lookonchain) April 21, 2025
At the time, the wallet was down $297,000, a narrative of continued losses. Fast forward to April 21, and the tables have turned. The wallet sold 2.69 million FARTCOIN ($2.47 million) at $0.92, locking in a $127,000 profit, revealed Lookonchain.
The whale’s decision to sell slightly above his entry price paid off, not only validating his conviction but also stirring increased market confidence in the asset.
Adding to the bullish sentiment, another whale stepped in on April 20, scooping up 2 million FARTCOIN for $1.7 million at an average of $0.85 per token. While this second entity has yet to take profit, their entry suggests that smart money anticipates more upside in the near term.
A whale bought 2M $Fartcoin($1.7M) at an average price of $0.85 7 hours ago.https://t.co/DG6w1OlWSR pic.twitter.com/WGA1goinYH
— Lookonchain (@lookonchain) April 20, 2025
Technical Breakdown: Fartcoin Eyes $1.07, Then $1.52
Looking at the daily FARTCOIN daily chart, the price action is moving cleanly inside a parallel ascending channel, a structure that often hints at a continuation trend with predictable support and resistance levels.
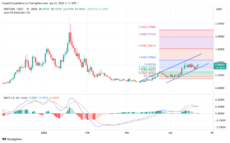
Fartcoin Price Chart | Source: TradingView
Support & Resistance:
Immediate support lies near $0.82, the lower trendline of the channel and also in confluence with the 0.618 Fibonacci retracement.
Immediate resistance is just overhead at $0.93–$0.95, right near the upper trendline.
The current upward momentum suggests a possible breakout above this resistance zone. If bulls manage to hold above $0.95, the next Fibonacci-based targets emerge at:
- $1.07 (1.618 Fib extension)
- $1.52 (2.618 Fib extension)
- $1.97 and $2.25 in the more extended bullish case
MACD Indicator shows a bullish crossover that’s just beginning to cool off slightly, but no strong bearish divergence is present yet. This supports the case for potential continuation of the upward trajectory.
Bearish Risks
If the price breaks down below the lower channel support near $0.82, eyes will turn to the 0.786 ($0.71) and 0.618 ($0.58) Fib levels for potential catch zones.
A break below $0.55 would invalidate the bullish structure and likely usher in deeper correction towards the $0.46 or even $0.35 levels.
0
0

 Manage all your crypto, NFT and DeFi from one place
Securely connect the portfolio you’re using to start.