Top Crypto Analysis: BTC, ETH, and SOL Move in Institutional Sync as Liquidity Returns

0
0
The post Top Crypto Analysis: BTC, ETH, and SOL Move in Institutional Sync as Liquidity Returns appeared first on Coinpedia Fintech News
Top Crypto Analysis for December 2025 reveals a rare and powerful alignment across Bitcoin, Ethereum, and Solana, where price action is being driven less by retail sentiment and more by institutional liquidity flows and whales. While each asset holds its own technical levels, yet their synchronized behavior in 2025 signals a much deeper shift in market structure.
Top Crypto Analysis Shows Institutional Patterns Across BTC, ETH, and SOL
Throughout 2025, it was evident that the broader crypto market displayed an unmistakable rhythm, most evident when comparing BTC price, ETH price, and SOL price side by side.
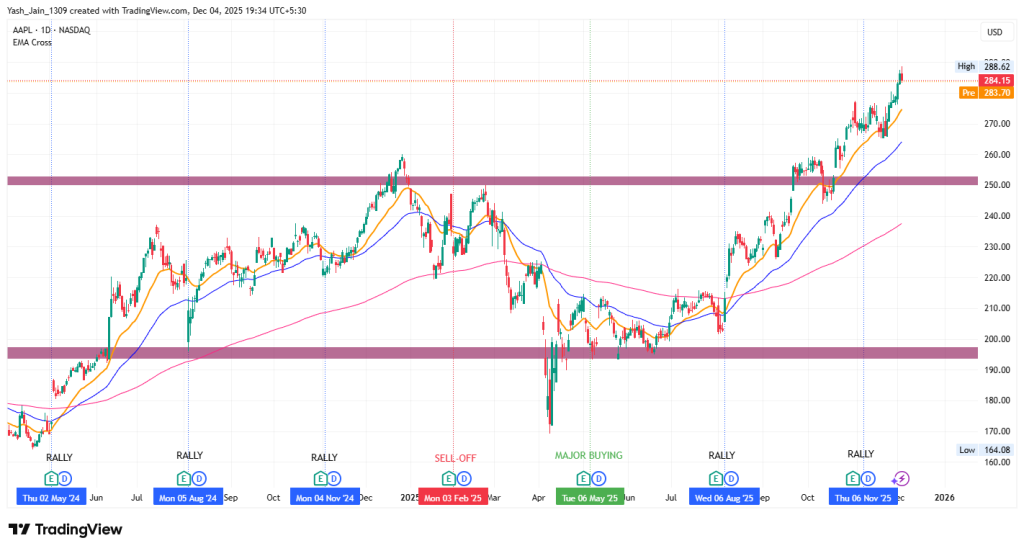
Unlike equities like Apple stock (AAPL/NASDAQ), where earnings and dividends dictate movement, the major crypto assets followed a synchronized structure that strongly suggested institutional influence and maneuvering.
The BTC crypto dominance is more than 58% and ETH has over 12%, both represent nearly 70% of the entire market. This dominance has further strengthened this dynamic, as smart money capital (not limited to ETFs only) entering Bitcoin and Ethereum has shown domino effects throughout other top crypto, too, like Solana.
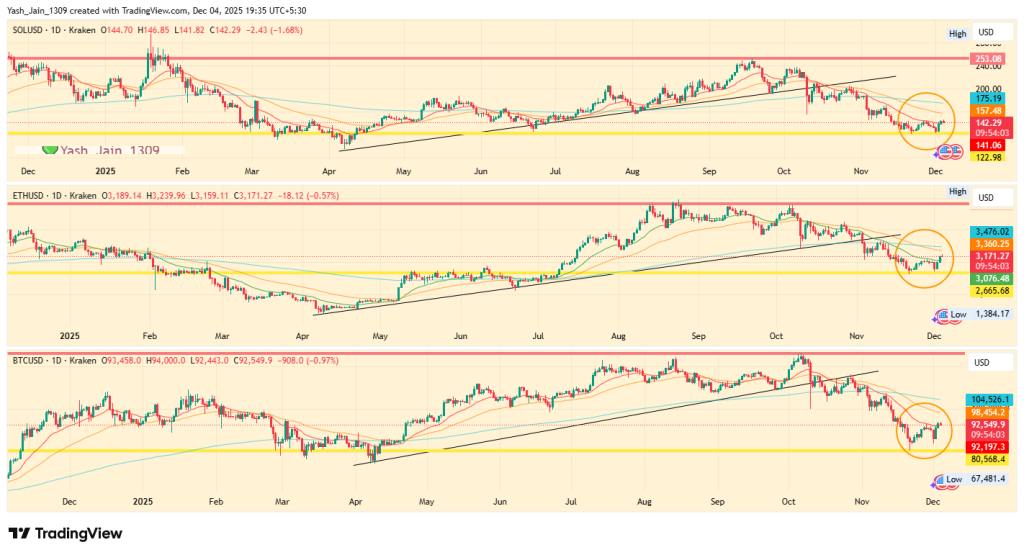
Seeing the chart, From April to early October, a clear uptrend emerged. The BTC price USD approached the $126,000 region before a severe correction set in, dragging the ETH price USD to some extent and SOL price USD, too into somewhat parallel declines. This mirrored behavior suggests that institutional entities and whales, including ETF-linked players and deep liquidity participants, were driving coordinated rotations.
Top Crypto Analysis Reveals Liquidity Shock as Catalyst for the Recent Rebound
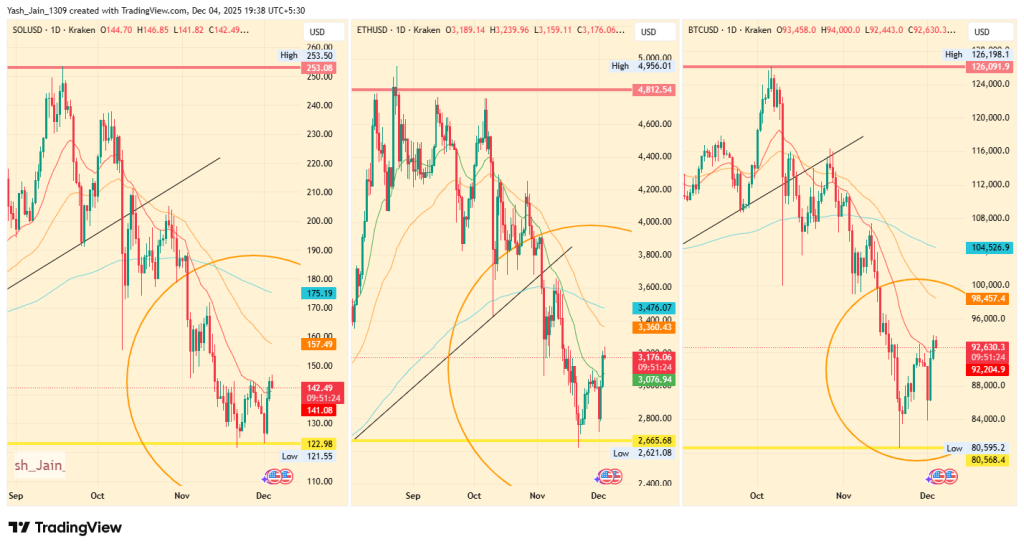
A key moment reinforcing this pattern unfolded on November 21, when BTC price hit the $80,600 support, and simultaneously ETH price touched $2,665 while SOL price USD tagged $123. Although each chart reflected unique candlestick formations, the timing of the reversals aligned perfectly, reinforcing the broader liquidity narrative captured in this trio, for instance.
The deeper macro backdrop explains the synchronized recovery. The U.S. Federal Reserve ended its multi-year quantitative tightening (QT) program on December 1, following the drawdown of roughly $2.4 trillion from its balance sheet between 2022 and 2025. That liquidity drain had pressured global markets, and crypto was no exception.
BREAKING
— Barchart (@Barchart) December 2, 2025: U.S. Banks
Fed Reserve just pumped $13.5 Billion into the U.S. Banking System through overnight reposThis is the 2nd largest liquidity injection since Covid and surpasses even the peak of the Dot Com Bubble
Probably Fine, carry on pic.twitter.com/NMLDARnAlM
Immediately after QT ended, the Fed injected $13.5 billion into the banking system through overnight repo operations, which was the second-largest liquidity boost since the pandemic.
The effect was instantly apparent: between December 1 and December 4, BTC/USD surged 11%, ETH jumped 15%, and SOL climbed 17%. This resurgence aligns with historical trends of risk assets to rally during periods of rising liquidity, hints at more recovery coming in December, and has renewed discussions around a potential Bitcoin price prediction of a new all-time high as early as late January 2026.
Top Crypto Analysis Tracks the Next Macro Trigger: BOJ and FOMC Ahead
However, the outlook is not without caution. With the Bank of Japan signaling an 81% probability of another rate hike in December after three previous hikes triggered broad crypto selloffs, markets are now preparing for heightened volatility.
The upcoming U.S. FOMC decision adds another layer of uncertainty, leaving BTC, ETH, and Solana crypto in a tightly reactive macro environment.
FOMC next week going to be pivotal pic.twitter.com/1dE2d2M9Ou
— Ethan(@EthanPromotes) December 4, 2025
As the final weeks of 2025 unfold, Top Crypto Analysis increasingly centers on liquidity, timing, and institutional behavior rather than isolated technical levels.
0
0

 Manage all your crypto, NFT and DeFi from one place
Securely connect the portfolio you’re using to start.


0
0
