Solana Faces 30 Percent Crash to $102? What the Charts and On-Chain Data Say
0
0

Solana (SOL) is back in the spotlight, but this time, it’s not entirely bullish. Despite surging network growth and record-level revenue, technical analysts are warning of a potential 30% crash, with key price targets between $102 and $105. As of mid-June 2025, SOL trades near $146, teetering on the edge of a breakdown or a breakout.
This tug-of-war between technical weakness and on-chain strength makes Solana one of the most closely watched altcoins in the market right now.
Technical Breakdown: Why Analysts See $102 Coming
Several analysts, including from Cryptonews and FXStreet, have identified a descending triangle on Solana’s weekly chart, a bearish formation that typically signals a move downward.
If SOL fails to hold the $140–145 support zone, traders expect a rapid slide toward $102, which represents a clean 30% correction.
Key Technical Levels for Solana (Q3 2025)
| Level | Significance |
|---|---|
| $180 | Resistance — must break for upside |
| $145 | Critical support — currently tested |
| $102–105 | Bearish target — if breakdown occurs |
Adding to the pressure is negative funding data from derivatives markets, where shorts are increasing and sentiment has turned risk-off.
Fundamental Strength: Revenue and Wallets Tell a Different Story
While the charts show fragility, Solana’s blockchain metrics remain rock-solid.
-
Daily Network Revenue: Over $4.79 million, exceeding Ethereum on some days.
-
DEX Volume: Topping $3.4 billion recently, the highest in its history.
-
Active Wallets: More than 3.25 million, leading all Layer-1 chains.
These figures underscore SOL ’s status as the fastest-growing Layer-1 smart contract platform, even during price volatility.

Alternative Views: Is a Reversal Also on the Table?
Some experts believe the bearish triangle might be invalidated. Analysts at Crypto.news noted a potential V-shaped recovery pattern, which could push SOL to $180–200, and even $252 in a breakout scenario.
For that bullish case to play out, SOL must defend the $145 zone and close above $180 in the coming weeks.
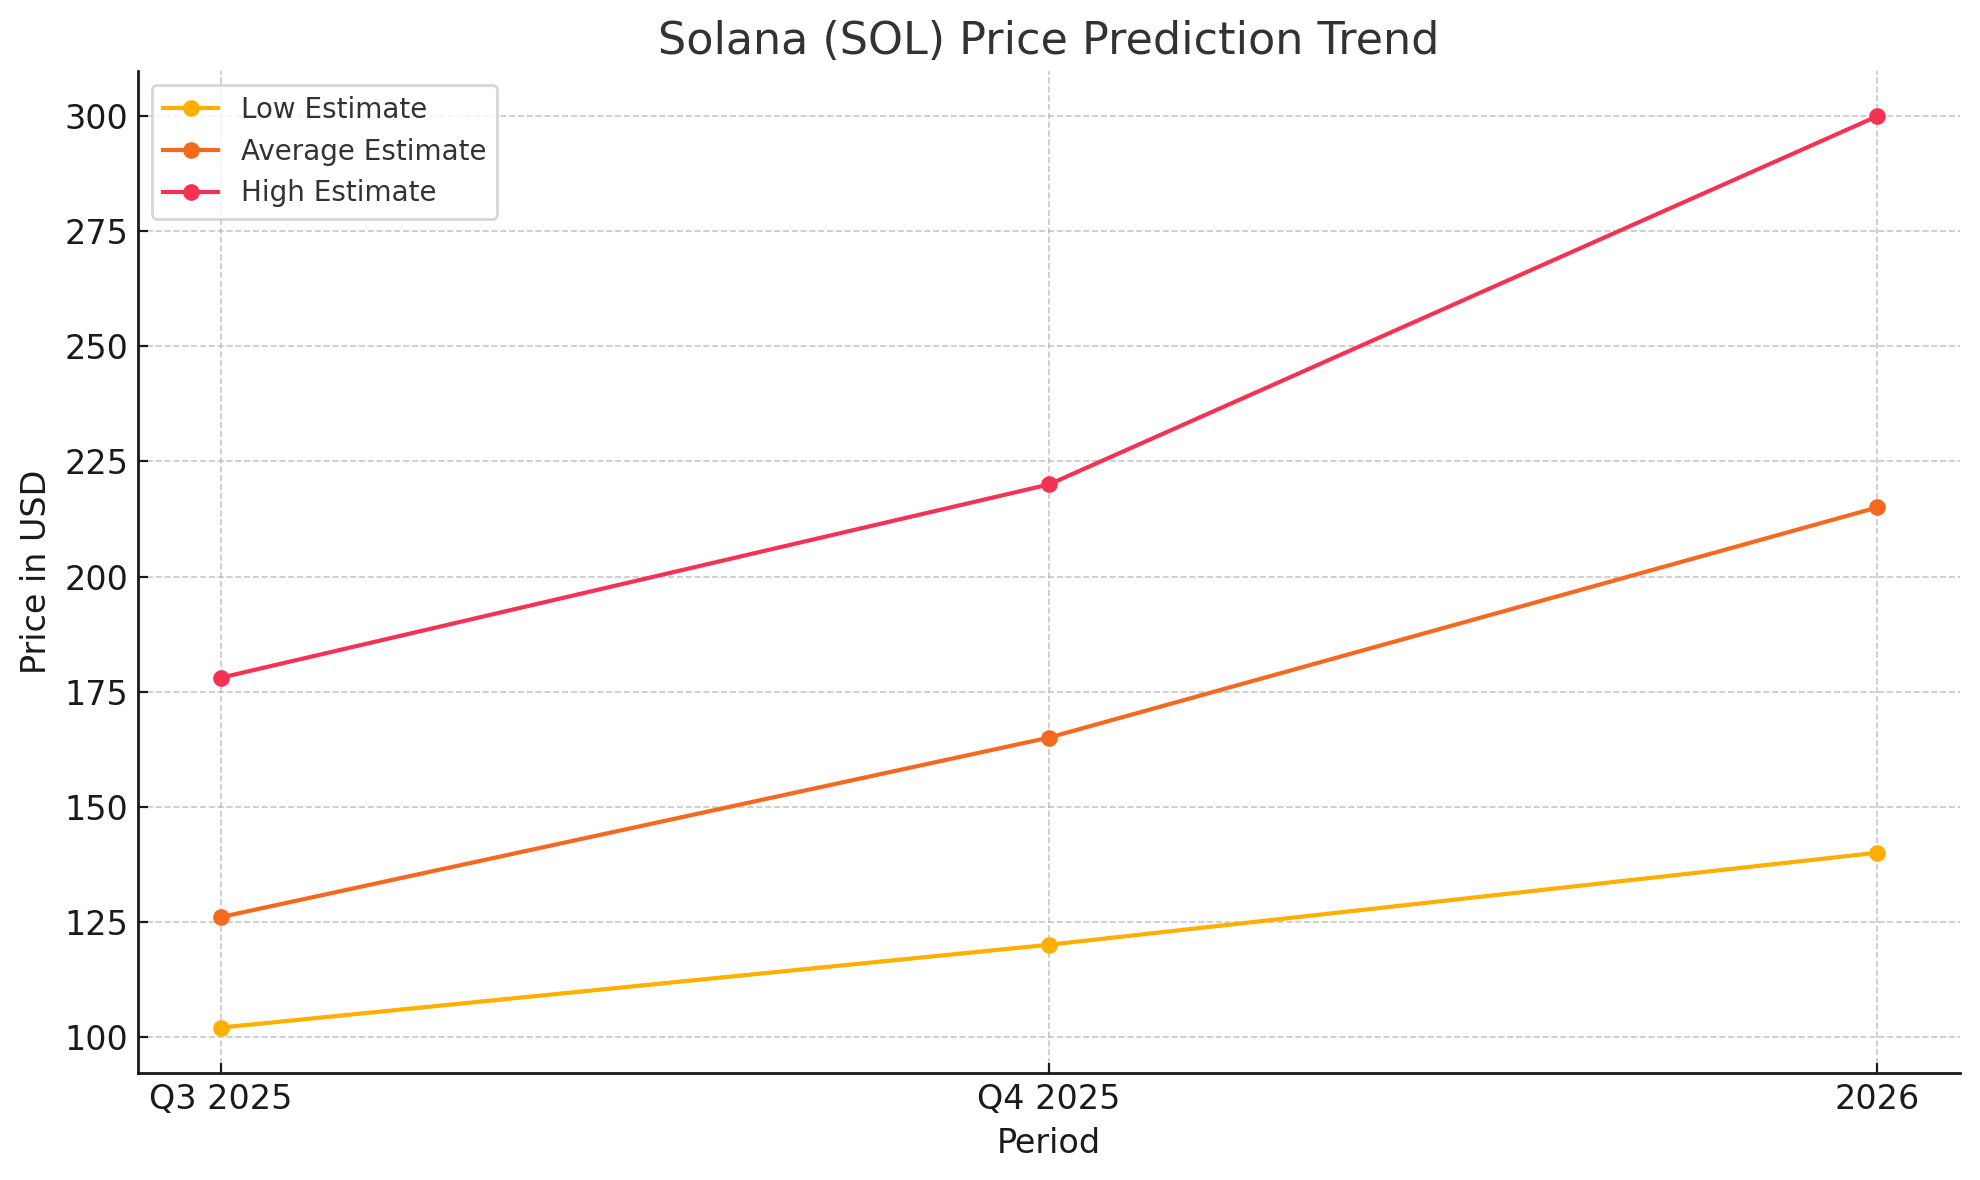
Solana Price Prediction Table
| Quarter | Low Estimate | Avg Estimate | High Estimate |
|---|---|---|---|
| Q3 2025 | $102 | $126 | $178 |
| Q4 2025 | $120 | $165 | $220 |
| 2026 (Year) | $140 | $215 | $300+ |
Beyond the Charts: Why Solana’s Ecosystem Still Matters
While technical traders focus on candlestick patterns and trendlines, long-term investors should look deeper. Solana is not just another speculative asset — it’s a high-throughput blockchain powering real applications. With thousands of developers, a vibrant NFT scene, leading GameFi integrations, and institutional partnerships, SOL has become a critical piece of the Web3 infrastructure.
Innovations like Solana Mobile (Saga) and Firedancer validator clients further enhance scalability and security. This ecosystem maturity is what sets SOL apart during market turbulence and could position it as the dominant Layer-1 solution in the next crypto cycle.

What Investors Should Watch Next
-
$140 Support Test: Holding this line could shift momentum back to bulls.
-
$180 Resistance: Breaking this level confirms a bullish reversal.
-
ETF Approval Rumors: VanEck and other firms are reportedly considering Solana ETF products.
-
Tokenomics Upgrade: Any upgrade in SOL ’s fee structure or staking model may significantly affect long-term valuation.
Conclusion: Solana’s Future Is a Tale of Two Trends
Solana stands at a decisive point. While bearish technical patterns forecast a potential 30% correction toward $102, on-chain data tells a different story — one of rapid adoption, unmatched speed, and growing institutional interest.
Whether one is a trader eyeing short-term breakdowns or a long-term investor focused on fundamentals, SOL is a blockchain that can no longer be ignored. They should keep eyes on the $140 support and $180 resistance — these levels could define Solana’s trajectory for the rest of 2025.
FAQs
Why are analysts predicting a 30% drop for SOL?
Technical charts show a bearish descending triangle pattern that often results in significant breakdowns if support fails.
Is Solana still strong fundamentally?
Yes. Despite short-term bearish signals, SOL leads in wallet activity, DEX volumes, and network revenue among Layer-1 chains.
Could SOL still reach $200 this year?
If Solana defends key support at $140 and breaks above $180, analysts see potential upside to $200 or even $250 by year-end.
Glossary of Key Terms
Descending Triangle
A bearish chart pattern formed by a series of lower highs and horizontal support.
Funding Rate
A fee paid by long and short traders in futures markets. Negative rates suggest bearish sentiment.
DEX (Decentralized Exchange)
A crypto exchange that operates without intermediaries, using smart contracts to execute trades.
V-Shaped Recovery
A rapid reversal from a downtrend to an uptrend, forming a V pattern on charts.
Total Value Locked (TVL)
The total capital deposited in a blockchain’s DeFi ecosystem indicates adoption and usage.
Sources and References
Read More: Solana Faces 30 Percent Crash to $102? What the Charts and On-Chain Data Say">Solana Faces 30 Percent Crash to $102? What the Charts and On-Chain Data Say
0
0
 Manage all your crypto, NFT and DeFi from one place
Securely connect the portfolio you’re using to start.


