HBAR Price Tests Critical $0.18 Resistance: Can Bulls Break Through?
0
0
Hedera HBAR $0.17 24h volatility: 6.5% Market cap: $7.28 B Vol. 24h: $251.45 M price increased over 5% on Tuesday, July 9, building on momentum from Grayscale’s recent announcement that it had added the token to its Smart Contract Platform Fund. The continued price surge, two days after the initial news, highlights sustained investor interest in HBAR’s institutional inclusion alongside Ethereum ETH $2 739 24h volatility: 4.8% Market cap: $330.17 B Vol. 24h: $20.30 B , Solana SOL $155.3 24h volatility: 1.9% Market cap: $83.16 B Vol. 24h: $4.81 B , Cardano ADA $0.62 24h volatility: 4.2% Market cap: $22.19 B Vol. 24h: $727.97 M , and Sui SUI $3.01 24h volatility: 3.3% Market cap: $10.38 B Vol. 24h: $566.24 M , replacing Polkadot DOT $3.57 24h volatility: 3.3% Market cap: $5.42 B Vol. 24h: $192.53 M in the Q3 2025 rebalance.
According to the updated Grayscale GSC fund allocation, HBAR now represents approximately 5.8% weight in the fund, trailing Cardano’s 18.57% and ahead of Avalanche’s 6.76%. Ethereum and Solana dominate with over 30% each, establishing HBAR’s position in the institutional conversation.
Every quarter, we rebalance and update the components of our multi-asset funds Grayscale DeFi Fund, Grayscale Smart Contract Fund, and Grayscale Decentralized AI Fund.
Read on for our Q3 updates 🧵 pic.twitter.com/dESsVwpq1j
— Grayscale (@Grayscale) July 7, 2025
Following this news, HBAR price broke above $0.17, positioning for its highest daily close since June 12. The RSI reading of 62.04 signals potential overheating, warranting caution as the price tests key resistance at $0.18.
HBAR Technical Analysis: Double-Bottom Pattern Eyes $0.28 Target
The HBAR daily price chart shows a classic double-bottom reversal pattern, with lows at $0.13 in mid-April and late June. This bullish setup hints at a 60% breakout if confirmed with a close above the neckline resistance near $0.22.
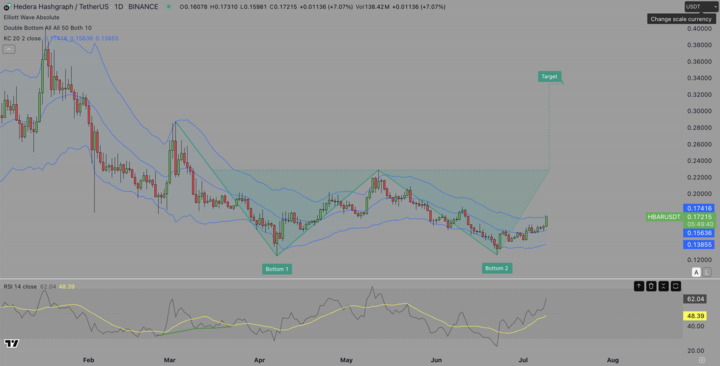
HBAR Price Prediction | Source: TradingView
If bulls manage a decisive close above $0.18, the technical projection from the double-bottom pattern sets the next major target at $0.28, coinciding with the previous rejection in March.
However, failure to break $0.18 could result in consolidation back to the $0.15 level, with strong support from both the EMA and Bollinger mid-band.
Solaxy: The Solana Layer 2 That’s Drawing Eyes from HBAR Bulls
With HBAR surging thanks to institutional tailwinds, investors are also exploring early-stage opportunities with Solaxy, Solana’s first Layer 2 solution. Designed for infinite scalability, Solaxy blends meme appeal with real Layer 2 infrastructure, making it attractive to both retail and corporate traders.
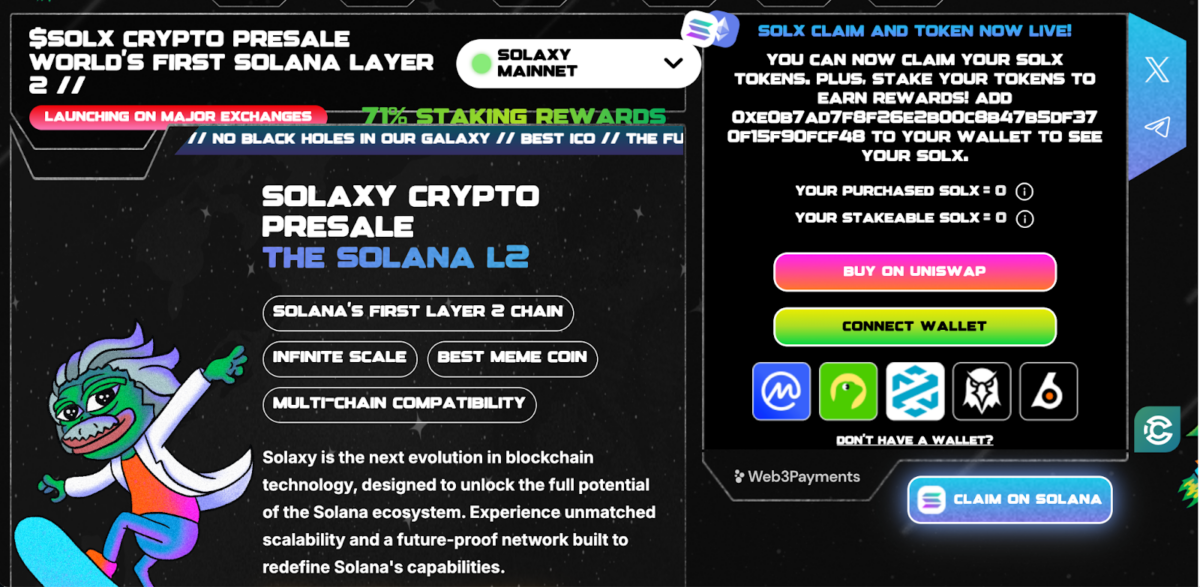
Now in presale, the $SOLX token offers staking APY as high as 71%, capturing attention from HBAR and Solana holders alike looking for early exposure to the next L2 breakout. Visit the official presale page to secure $SOLX before launch.
The post HBAR Price Tests Critical $0.18 Resistance: Can Bulls Break Through? appeared first on Coinspeaker.
0
0

 Manage all your crypto, NFT and DeFi from one place
Securely connect the portfolio you’re using to start.
