Bitcoin stays stuck in range as bulls eye Fed pivot, SKY, HYPE, SPX buck market downturn

0
0

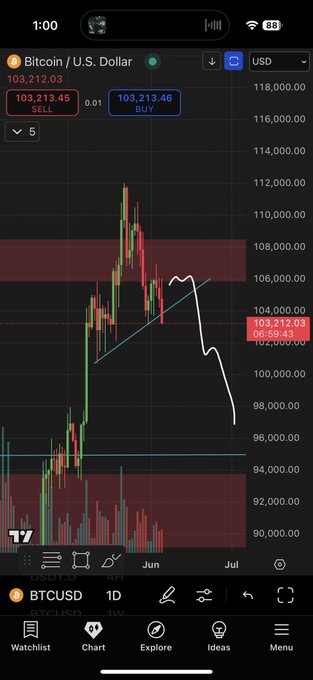
Bitcoin remained stuck within a tight range of $100,984 to $106,723 this week, as bearish forces continued to suppress risk appetite.
A 5% decline in overall market value brought crypto capitalisation down to $3.38 trillion by late Asian trading hours on Friday.
Sentiment weakened in tandem, with the Fear and Greed Index retreating to 45 for the first time since April.
Altcoins posted a sluggish performance, with most major tokens ending the week in the red, while a few managed to notch modest gains.
Why is Bitcoin going down?
Bitcoin started the week on shaky ground, weighed down by global risk aversion sparked by stalled trade talks between the U.S. and China and renewed Russia-Ukraine tensions.
Analysts warned that markets had begun pricing out hopes of a resolution amid a lack of progress on peace negotiations.
Sentiment worsened as reports emerged that, though President Donald Trump had been involved in backchannel talks, no formal statements followed.
By midweek, profit-taking added to the pressure. Glassnode data showed entity-adjusted realised profit surpassing $500 million per hour multiple times, the most aggressive selling since early February.
This came as Federal Reserve Chair Jerome Powell held a cautious line on interest rates, saying further data was needed before considering cuts.
Tensions escalated further on June 5 following a public spat between Trump and Elon Musk, who had previously been political allies.
Musk criticised Trump’s “Big Beautiful Bill” and supported calls for impeachment.
Trump responded by threatening to end Musk’s government contracts, triggering a sharp decline in market sentiment.
Bitcoin dropped 5.2% to $100,400 on Bitstamp, sparking panic selling and a wave of liquidations totalling $979.9 million.
Long positions accounted for $874 million, the largest single-day wipeout since February 25.
By June 6, stronger-than-expected U.S. labour market data helped Bitcoin recover past $104,000.
However, uncertainty lingered as Trump again urged a full percentage point rate cut, calling Powell “too late” and comparing the Fed unfavourably to European central banks that have already cut rates.
Will Bitcoin crash?
Most analysts remained cautious, with several pointing to growing downside risks amid weakening market structure and shifting liquidity zones.
According to CryptoQuant’s Axel Adler Junior, the next key support level lies near the short-term holder (STH) realised price at around $97,500, a zone that may act as a cushion if current levels fail.

This aligns with broader on-chain metrics suggesting a heightened probability of further downside, especially as long-term holders remain relatively inactive.
Meanwhile, popular trader TheKingfisher observed a concentration of long liquidation levels between $99,000 and $102,000, describing the zone as a “huge magnetic area” that could attract price action lower.
In contrast, short liquidation zones above $104,500 were sparse, creating what he called a “strong imbalance” that increases the risk of a downward liquidity cascade.
He warned that while retail traders may interpret the range as support, it could instead be a classic liquidation trap, a setup that draws in longs before a sharp breakdown.
Trader Roman echoed that sentiment, noting that Bitcoin’s high-timeframe charts are “bearish all over” and suggesting that a breakdown is already underway.
Meanwhile, fellow trader Friedrich believes Bitcoin could revisit the $105,000 zone before correcting toward $87,000, unless it manages to reclaim support between $105,800 and $106,000.

A recovery above $106,000, he noted, would be key to reviving hopes of a move toward new all-time highs.
Even among those with a bullish outlook, there’s growing recognition that Bitcoin may face more short-term pressure before any meaningful rebound.
Technical analyst Kevin Svenson flagged weakness in Bitcoin’s daily RSI, calling it a critical structure to watch.
While the indicator continues to point lower, he suggested a reversal signal could emerge within the next week if momentum stabilises.

Fed interest rate decision could spark rally
Others, like CMC Markets analyst Carlo Pruscino, believe the upcoming interest rate decision could play a pivotal role in determining Bitcoin’s next major move.
While markets widely expect the Federal Reserve to hold rates steady at its June 18 meeting, with CME’s FedWatch Tool showing a 97.5% probability of no change, Pruscino believes a surprise shift in timing could catch investors off guard.
If the Fed cuts rates “a lot sooner than expected,” it could act as a major upside catalyst for crypto, with Bitcoin potentially targeting the psychological level of $112,000, he told the media in recent comments.
However, “there needs to be a continuation of improved risk sentiment” and clearer signals on trade policy before the rally can resume, he added.
Pruscino also pointed to the lingering uncertainty caused by President Trump’s tariff threats, which he said may complicate the Fed’s decision-making. While the central bank has “enough data” to consider cuts, shifting trade dynamics could keep policymakers in wait-and-watch mode.
At the time of writing, Bitcoin was hovering near $105,000, down 0.4% on the week after giving up most of its early gains.
Altcoin market tanks
Over the past week, the altcoin market cap initially rose 9% to $1.34 trillion on June 4, but later saw a sharp correction to $1.2 trillion, resulting in a weekly loss of approximately 2.4% as of the time of writing.
The Altcoin Season Index stands at 25, a strong indication that Bitcoin remains the dominant factor influencing the broader cryptocurrency market sentiment.
Ethereum (ETH), the largest altcoin by market cap, fell 3.5% over the past 7 days, priced at $2,500 as of press time with a market cap of over $300 billion, while other large-cap altcoins like BNB (BNB), Solana (SOL), Dogecoin (DOGE) and Cardano (ADA) experiencing losses ranging between 3-10%.
Sky (SKY) led the highest gains this week, up 11.6%, which raised its market cap to over $1.57 billion, while Hyperliquid (HYPE) and SPX6900 (SPX) followed with gains of little over 10% each.

Source: CoinMarketCap
SKY rallied following the launch of USDS staking rewards for SKY holders, prompting many investors to swap their MKR tokens for SKY to earn 50% of the platform’s surplus USDS revenue.
HYPE locked in some profits after securing a Binance.US listing, while SPX rallied on community-driven hype around its satirical bid to “flip” the traditional stock market and draw in more investors.
If the current momentum holds, traders are also growing optimistic about a potential listing on tier-1 exchanges like Binance or Coinbase for SPX.
The post Bitcoin stays stuck in range as bulls eye Fed pivot, SKY, HYPE, SPX buck market downturn appeared first on Invezz
0
0


 Manage all your crypto, NFT and DeFi from one place
Securely connect the portfolio you’re using to start.

0
0


0
0
