XDC Network Spikes Over 17%, How Much Higher Can XDC Go?

0
0

- XDC emerged as one of the top gainers, posting a strong 17.75% gain in the past 24 hours.
- XDC bounced back from a low of $0.06022, recovering over 27% within the week.
After a rough week, the global crypto market kicked off the day with a bit of a breather. Bitcoin (BTC) bounced back above $83.5K, helping push the total market cap up to $2.94 trillion — a 3% increase in the last 24 hours. Amid this slight recovery, XDC Network (XDC) stood out as one of the top performers with an impressive 17.75% gain.
XDC began the day at $0.06525 and rallied to a high of $0.07683, backed by strong bullish activity. At the time of writing, it trades at around $0.07449, with daily trading volume climbing over 61% to $45.16 million. Over the past week, XDC has gained 9.32%, bouncing back sharply from a low of $0.06022 — marking a strong 27% recovery.
XDC Technical Analysis: Bullish Momentum Builds Across Timeframes
On the 4-hour chart, XDC shows signs of a bullish reversal. After a steep dip to $0.05990, the price quickly surged back up without much consolidation — forming a V-shaped recovery. It’s currently testing the key resistance at $0.07474 (100% Fibonacci level). A break and hold above this level could confirm continued upward movement. If not, it may revisit the $0.06557 support level.

Indicators back the bullish setup:
- MACD shows a clear bullish crossover with growing momentum.
- CMF sits at 0.05, suggesting mild but steady buying pressure.
On the daily chart, XDC recently broke out from a long consolidation between $0.064 and $0.071. This move forms a potential rounded bottom — often a bullish continuation sign. The next resistance levels to watch are $0.07941 and $0.08550, with strong support near $0.07073 and $0.05968.
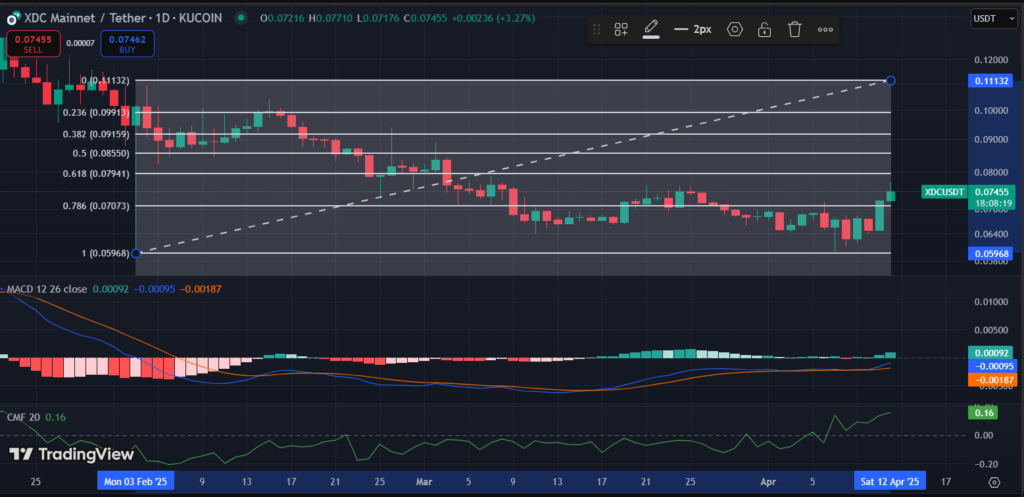
If bulls maintain this momentum and flip $0.07941 into support, XDC could aim for the $0.085–$0.091 zone in the coming days.
| Metric | 4-Hour Chart (4H) | Daily Chart (1D) |
| Pattern | V-Shaped Recovery after a sharp drop | Rounded Bottom / Accumulation Breakout |
| Trend | Short-term bullish continuation | Possible shift from downtrend to uptrend |
| Fibonacci Key Levels | 0.07474 (hit 100% Fib target) | 0.07941 next resistance (0.618 level) |
| MACD | Bullish crossover with rising histogram | Bullish crossover confirmed; MACD line climbing |
| CMF | Slightly positive (0.05) | Strongly positive (0.16) — strong buying pressure |
| Price Behavior | Fast rebound from $0.05990 to $0.07474 | Breakout after long consolidation between 0.064–0.071 |
| Support Levels | $0.07124, $0.06907, $0.06557 | $0.07073 (Fib 0.786), major support near $0.05968 |
| Resistance Levels | $0.07474 (current), potential move beyond | $0.07941 (Fib 0.618), $0.08550 (Fib 0.5) |
| Outlook | Short-term bullish, could consolidate or retest supports | Trend reversal possible if price sustains above $0.079 |
Both timeframes support a bullish bias, but confirmation above $0.079–$0.085 on the daily will be key for XDC to sustain its move.
Highlighted Crypto News Today:
Bitcoin Struggles to Break Resistance at $83K After Recent Market Crash
0
0


 Manage all your crypto, NFT and DeFi from one place
Securely connect the portfolio you’re using to start.


