
XRP Price Prediction: Can Bulls Break the $1.65 Resistance Wall?

0
0

Editor's note: Price levels below reflect market data as of the last-updated timestamp above. XRP is highly volatile — figures may shift significantly within hours.
$XRP is trading near a level that could shape its next big move. After weeks of sideways action, $XRP price has pushed from around $1.00 up to $1.70, and it now sits below $1.50. Traders are watching one number closely: $1.65.
This XRP price prediction breaks down the key support and resistance zones, what the charts are showing, and what could happen next as Bitcoin and Ethereum also test their own resistance walls.
XRP Derivatives Data Snapshot
The altcoin is currently trading at $1.497, up 7.51% over the past 24 hours. Derivatives activity has picked up alongside the price move, per Coinglass data:
24-hour derivatives volume: $22.28 billion
Open interest: $3.66 billion (+5.50%)
Options volume: $18.46 million (-18.76%)
Options open interest: $107.41 million (+3.92%)
Long/short ratio: 0.946 (roughly balanced sentiment)
24-hour liquidations: $121.39 million total — $77.41 million longs, $43.98 million shorts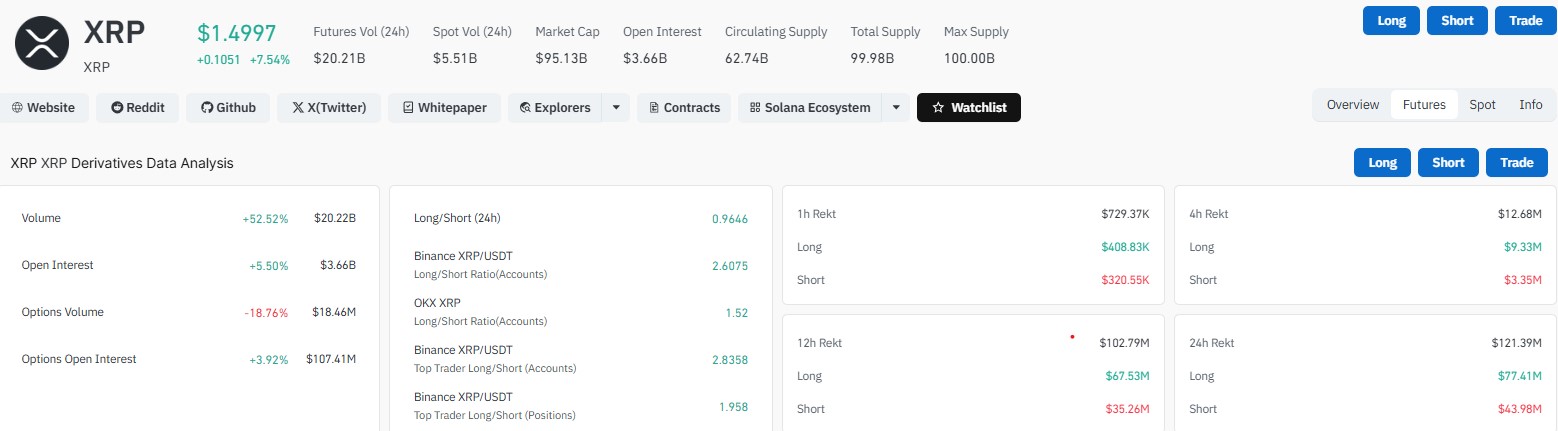
The elevated volume and open interest suggest strong participation, but the liquidation split shows longs have taken the bigger hit recently — a sign the rally is getting tested.
What Is XRP's Key Resistance Level Right Now?
The daily chart shows it has broken above its 20, 50, and 100 EMAs, and has also cleared the 200 EMA near $1.345. That's notable — the 200 EMA had capped the altcoin for months and may now act as support instead of resistance.
The real test, though, is the $1.65 to $1.70 zone. Analyst EGRAG CRYPTO has flagged $1.65 as the current battleground, noting its role in both the earlier decline and the recent recovery.
If the altcoin closes above $1.70 on the daily chart, $1.80–$1.90 is the next likely stop, with $2.00 emerging as the broader psychological target.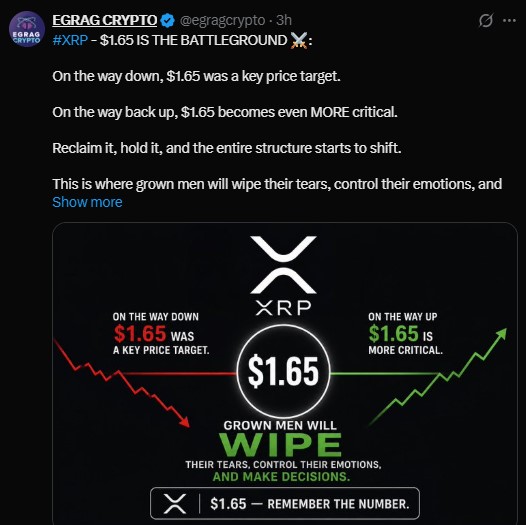
Is XRP Overbought Right Now?
The daily RSI is sitting around 87 — a high reading that typically signals an asset is overbought. That doesn't guarantee a crash, but it does suggest some cooling off or a short pullback would be normal after such a fast move.
Large holders reportedly picked up close to 190 million coins in a single day, and XRPL activity has also picked up — both pointing to renewed interest from larger players rather than retail alone.
What Are XRP's Support Levels on a Pullback?
If the altcoin fails to clear $1.65 right away, the first support sits near $1.45. Below that, the $1.35–$1.40 zone matters most, lining up with the 200 EMA and the recent breakout base.
Holding that zone keeps the bullish structure intact. A daily close below $1.35 would weaken the setup and could open the door to a deeper pullback toward $1.17–$1.20, near the 100 EMA.
$XRP Key Price Levels
| Level Type | Price Zone | Note |
| Major resistance | 1.65–1.70 | Battleground zone, breakout retest |
| Upside target | 1.80–1.90 | If $1.70 closes above on the daily chart |
| Psychological target | $2.00 | Next major round number |
| Support | $1.45 | First line of defense on a pullback |
| Support | 1.35–1.40 | Near 200 EMA and breakout base |
| Downside risk | 1.17–1.20 | Near 100 EMA if $1.35 breaks |
Does the 50-Week EMA Matter for XRP?
Market commentator ChartNerd has drawn a comparison between XRP's current chart structure and the setup around its 2022 cycle bottom.
The 50-week EMA is the marker to watch — a reclaim of this longer-term trend line would support the idea that XRP is shifting from a recovery phase into a more sustained uptrend.
If the altcoin clears the 50-week EMA at the same time it breaks $1.65, both signals together would strengthen the bullish technical case.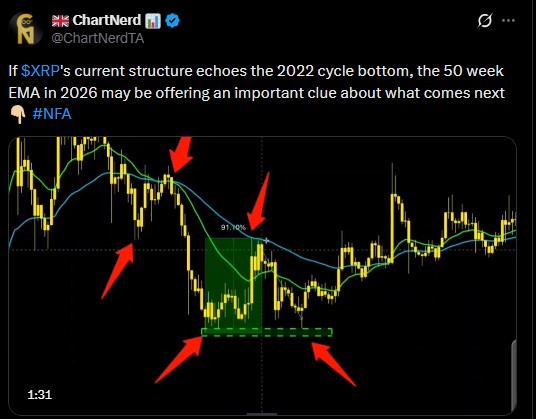
How Are Bitcoin and Ethereum Affecting the XRP Market?
XRP isn't moving in isolation. Bitcoin recently touched near $79,463 before pulling back almost 3%, running into resistance between its 50-week and 100-week EMAs (roughly 77,000–79,000).
Ethereum was rejected from its 100-week EMA near $2,475 and dropped about 6% within a few hours after an earlier rally.
Both moves followed the U.S. Treasury's decision to expand its long-term bond buyback program, which some strategists say pushed extra liquidity into risk assets, including crypto.
Over $1.36 billion in crypto positions were liquidated across the market in the past 24 hours — Bitcoin and Ethereum took the largest hits, followed by XRP at nearly $122 million.
That kind of broader volatility can spill into XRP price action even when its own chart looks technically strong.
What's the Regulatory Backdrop for XRP?
Ripple CEO Brad Garlinghouse recently took part in private talks on the CLARITY Act with the U.S. Commerce Secretary.
Momentum around the bill has been building, with industry watchers expecting either a Congressional vote or new SEC/CFTC rulemaking in the coming weeks.
Clearer digital asset rules could matter for how XRP and other tokens trade going forward, though nothing is finalized yet.
Bottom Line
XRP's setup is bullish but stretched. The break above the 200 EMA is a real structural shift, and large-holder accumulation adds some weight to the story — but an RSI near 87 means a cooldown or small dip wouldn't be surprising before any real push toward $1.65 and beyond.
The clearest signal for what comes next: whether the altcoin can close above $1.65 and hold it as support on a retest.
Disclaimer
This article is for informational purposes only and does not constitute financial, investment, or trading advice. Cryptocurrency markets are highly volatile and unpredictable. Always do your own research and consult a licensed financial advisor before making any investment decisions. Past performance is not indicative of future results.
0
0

 Manage all your crypto, NFT and DeFi from one place
Securely connect the portfolio you’re using to start.


