Could a Falling Wedge Breakout Push Arbitrum (ARB) Price to $1?

0
0

Key Insights:
- Arbitrum price has spent 12 months inside a falling wedge, now nearing a critical breakout zone around $0.39
- Bearish funding rates and persistent net outflows contrast with aggressive growth in holders — a classic early reversal setup
- MVRV Z-Score at -5.39 signals extreme undervaluation, while RSI divergence adds fuel to the breakout thesis
The Arbitrum (ARB) price has quietly corrected for nearly a year, locked inside a falling wedge that may finally be close to giving out. At $0.33 today, the ARB price is still trailing far behind its 2024 highs, down nearly 50% year-over-year. But if this structure breaks, the path to $1 isn’t as far-fetched as it looks.
Arbitrum Price: Netflows and Funding Rates Tell a Split Story
On the surface, sentiment around the Arbitrum price remains shaky. The latest netflow chart shows consistent outflows from exchanges over the past six weeks.
This generally implies traders are withdrawing ARB tokens to hold or to park elsewhere, suggesting a lack of intent to sell in the short term. Despite this, the ARB price hasn’t reacted positively, which adds to the confusion.

Holders Keep Accumulating
Santiment data shows that the total number of unique addresses holding ARB has now crossed 2.05 million, a sharp jump from March levels.
That’s a 6% rise in just over three months, during a period where the Arbitrum price has actually fallen. The divergence is striking.
While price action remains stuck, wallet growth hints that retail or long-term investors may be quietly stacking tokens.

This kind of behavior; rising holders during a correction, often precedes price recoveries.
In previous market cycles, similar accumulation phases showed up just before upside breakouts. The ARB price may be stuck at $0.33 now, but the crowd doesn’t seem to care.
MVRV Z-Score Signals Deep Undervaluation
As of July 7, Arbitrum’s MVRV Z-Score stands at -5.39, per Santiment data. The Market Value to Realized Value (MVRV) ratio is a metric that compares the current price of a token to the average price at which tokens were last moved. The Z-score simply standardizes that difference.
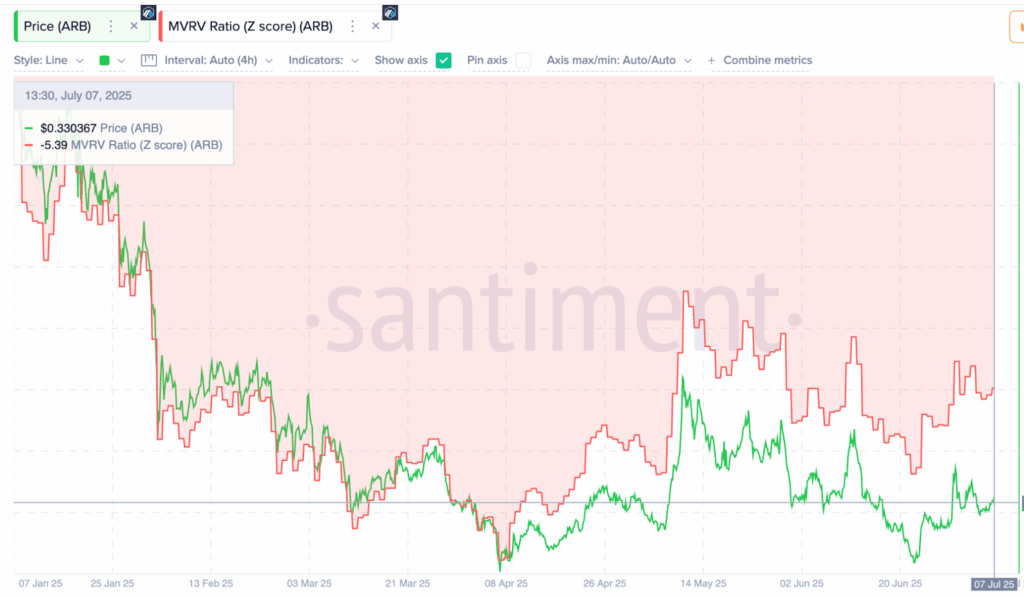
When the MVRV Z-Score dips below -1.0, it usually means the asset is undervalued. At -5.39, the Arbitrum price is flashing one of its most discounted readings on record. In previous cases, across multiple altcoins, levels this low have coincided with major bottoms.
For the ARB price, that adds a layer of conviction. It’s not just holding up structurally; it may actually be mispriced altogether.
ARB Price Structure Points to a Coiled Spring
Now for the technicals. The ARB price has traded inside a falling wedge since August 2023, with the upper trendline now sitting around $0.39. A clean break above this level would flip the structure bullish and trigger the next Fibonacci targets, which sit at $0.49, $0.56, and $0.66.
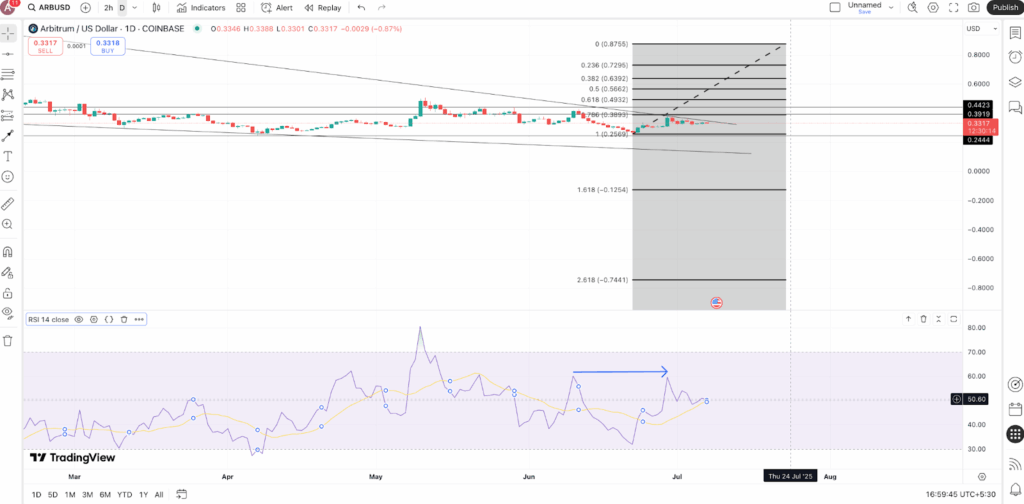
Why those levels? The Fibonacci retracement from the 2024 high near $0.88 to the recent bottom at $0.25 places 0.382, 0.5, and 0.618 resistance zones at those price points.
Given the sharp drop that preceded the wedge, there aren’t many historical resistance points left in between. If bulls push through, momentum could accelerate quickly, and the $1 level comes back into play.
What adds more fuel here is the Relative Strength Index (RSI). Even as the ARB price made lower highs in June and July, the RSI printed a flat line. This hints at bullish divergence, a signal that momentum may be shifting under the hood.
If the Arbitrum price breaks the $0.39 ceiling, the breakout might just come sooner.
The post Could a Falling Wedge Breakout Push Arbitrum (ARB) Price to $1? appeared first on The Coin Republic.
0
0

 Manage all your crypto, NFT and DeFi from one place
Securely connect the portfolio you’re using to start.


