Bitcoin Price Breakout Puts $78,000 in Sight, But One Risk Remains

0
0
Bitcoin price is trading above $73,700 at press time after rising almost 11% over the past seven days, driven by a breakout from a classic cup-and-handle pattern.
The move has pushed the crypto market’s largest asset toward a key resistance zone. While technical momentum and strong buying pressure support the rally, several indicators suggest the next leg toward $78,000 is possible but may face resistance.
Bitcoin Price Breakout From Cup-and-Handle Pattern Targets $78,000
Bitcoin’s latest rally accelerated after the price broke above the handle resistance of a cup-and-handle pattern on March 13, as predicted in our previous BTC analysis.
When the price clears the handle’s resistance line, traders typically measure the expected move by projecting the depth of the cup upward from the breakout point. In Bitcoin’s case, that projection suggests a potential move toward the $78,000 region.
Want more token insights like this? Sign up for Editor Harsh Notariya’s Daily Crypto Newsletter here.
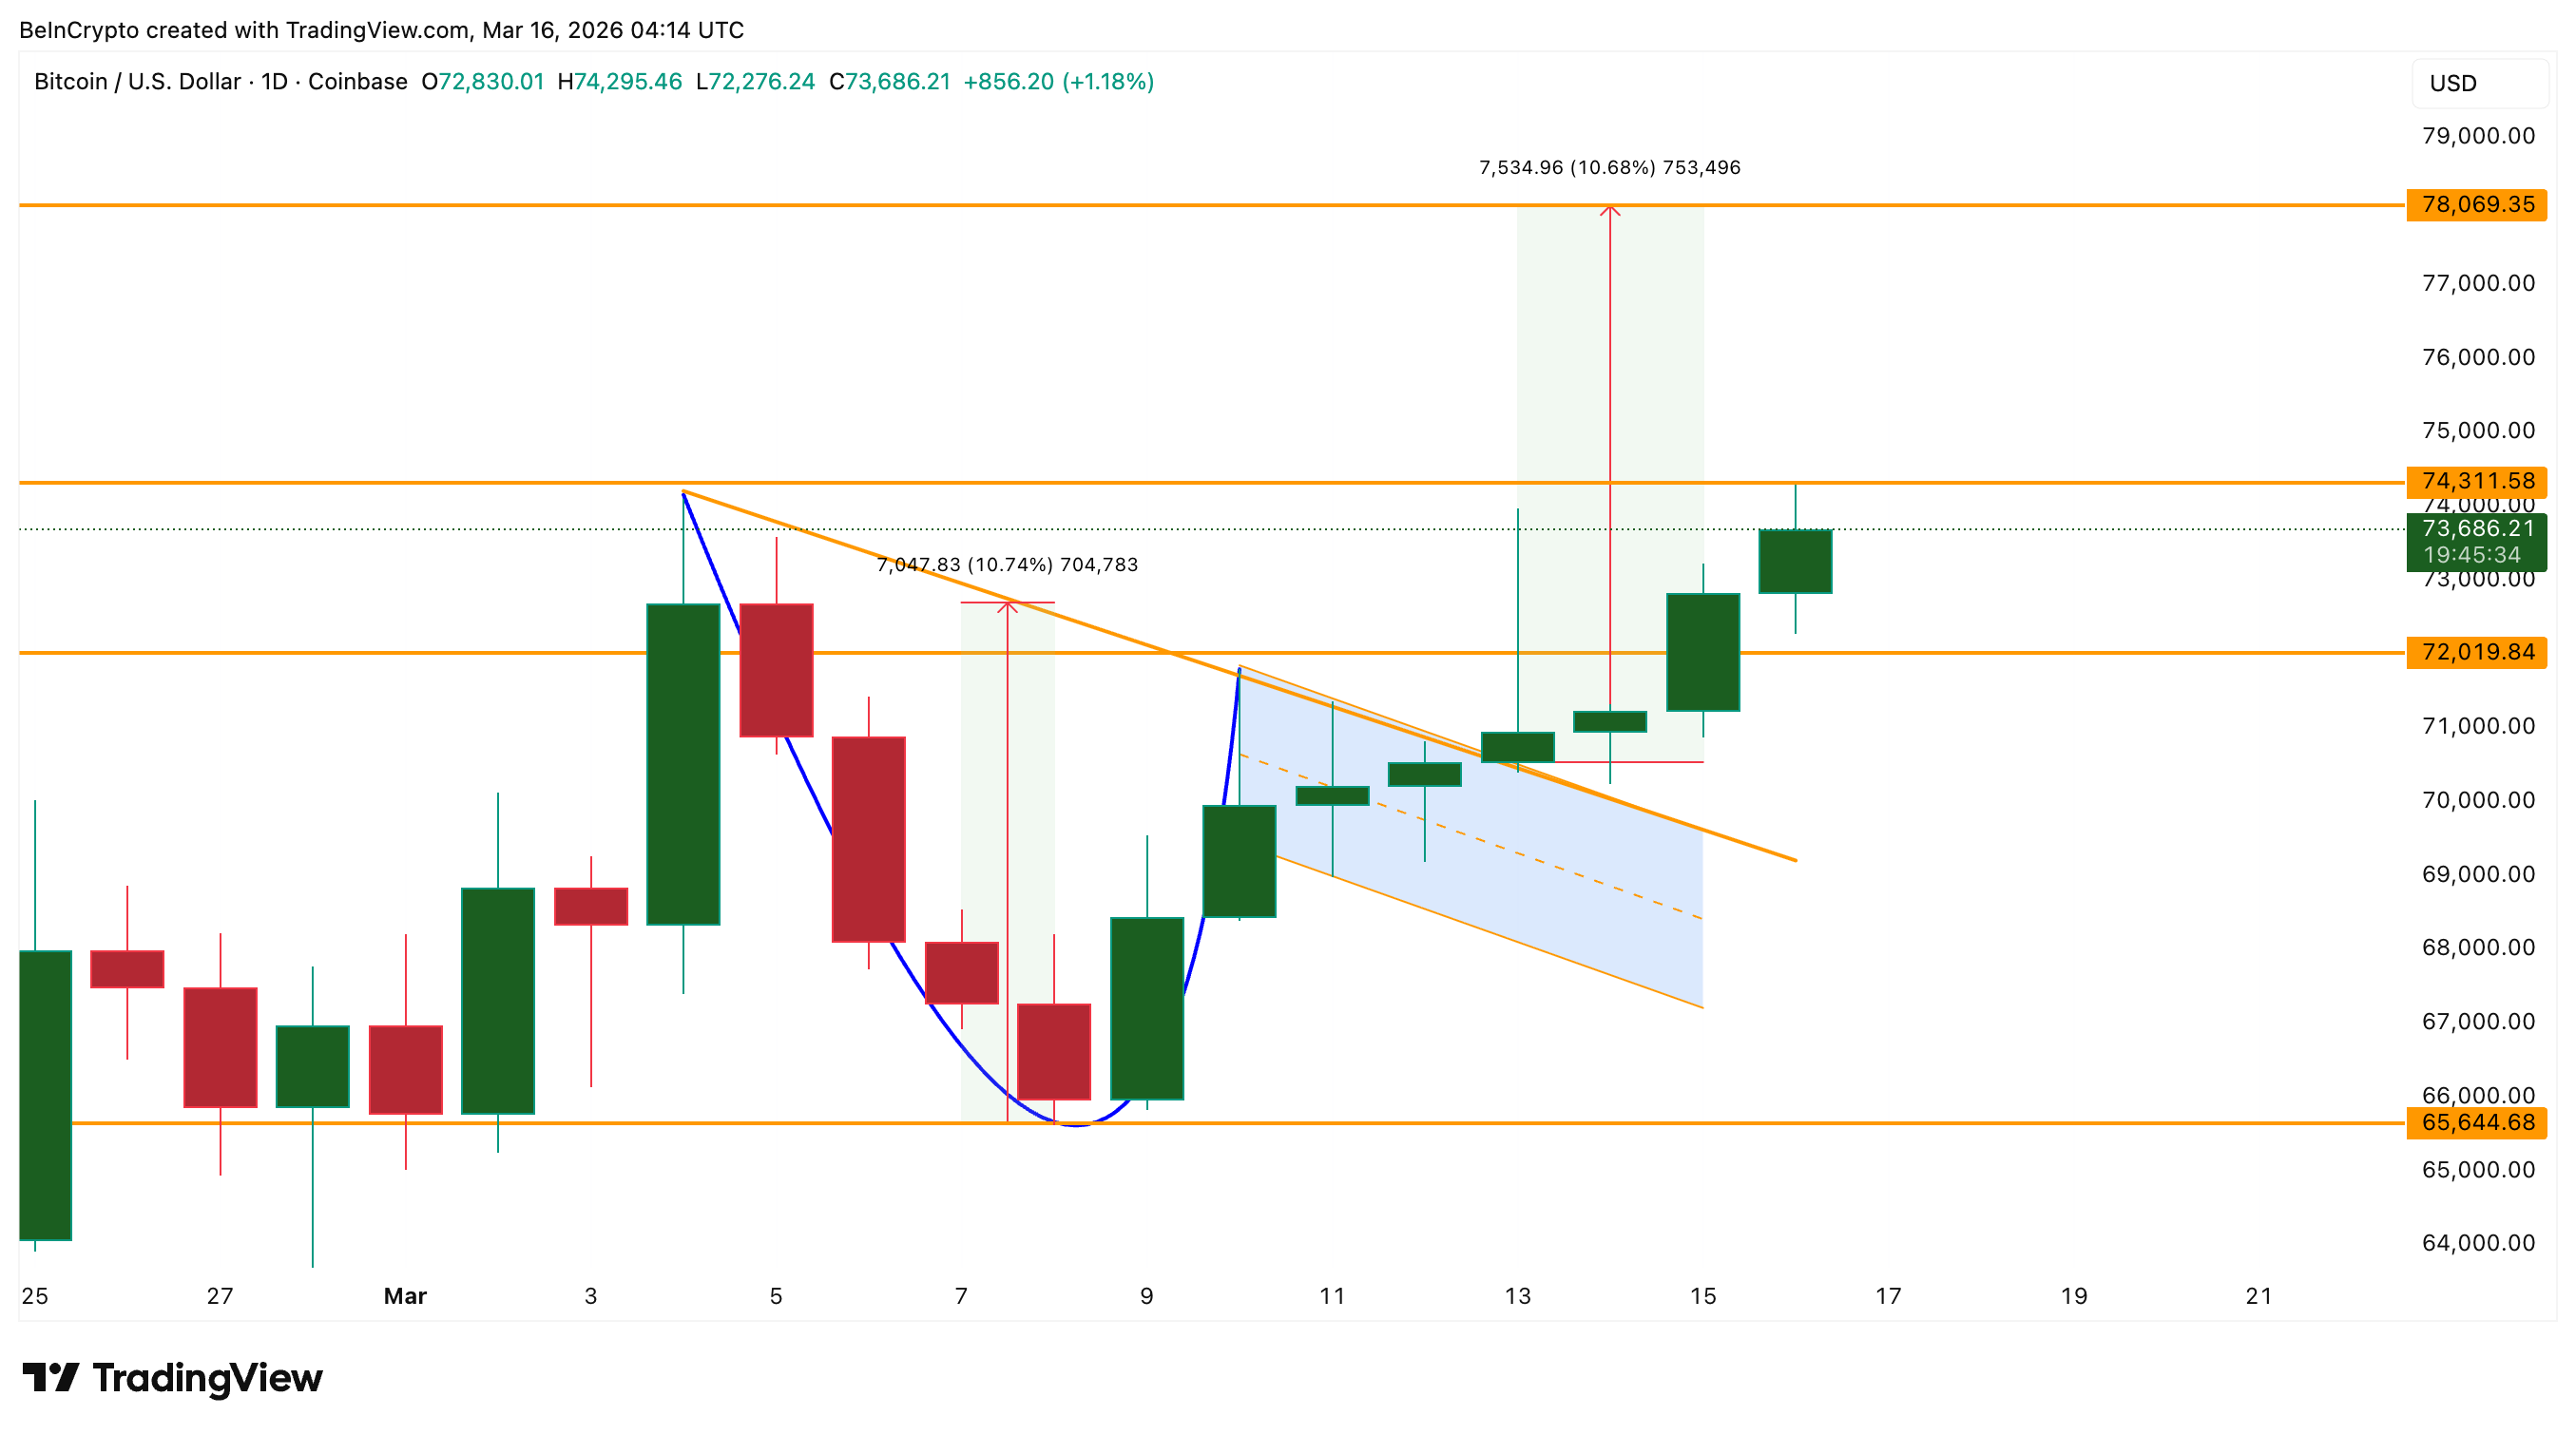 Bitcoin Price Breakout: TradingView
Since the breakout, Bitcoin price climbed quickly toward $74,300 before pulling slightly lower. The candles printed since March 13 also show repeated upper wicks, which means sellers are attempting to defend the resistance zone.
That behavior does not invalidate the bullish breakout, but it suggests the rally may face some short-term friction before attempting another leg higher. To understand whether the rally still has strength, it helps to examine how capital is flowing into the market.
Capital Inflows Slowing Despite Rising Bitcoin Price?
One early signal of potential slowing momentum appears in the Chaikin Money Flow (CMF) indicator.
CMF is a volume-weighted indicator used to measure whether large capital is flowing into or out of an asset. When CMF stays above zero, it generally signals buying pressure. Rising CMF suggests stronger inflows, while falling CMF indicates that inflows are weakening.
Between March 4 and March 16, the Bitcoin price trended slightly higher. During the same period, however, the CMF indicator moved aggressively lower. This creates a bearish divergence setup, where price rises but the intensity of buying pressure declines. That could also mean some big investors booking profits, which validates the upper candle wicks.
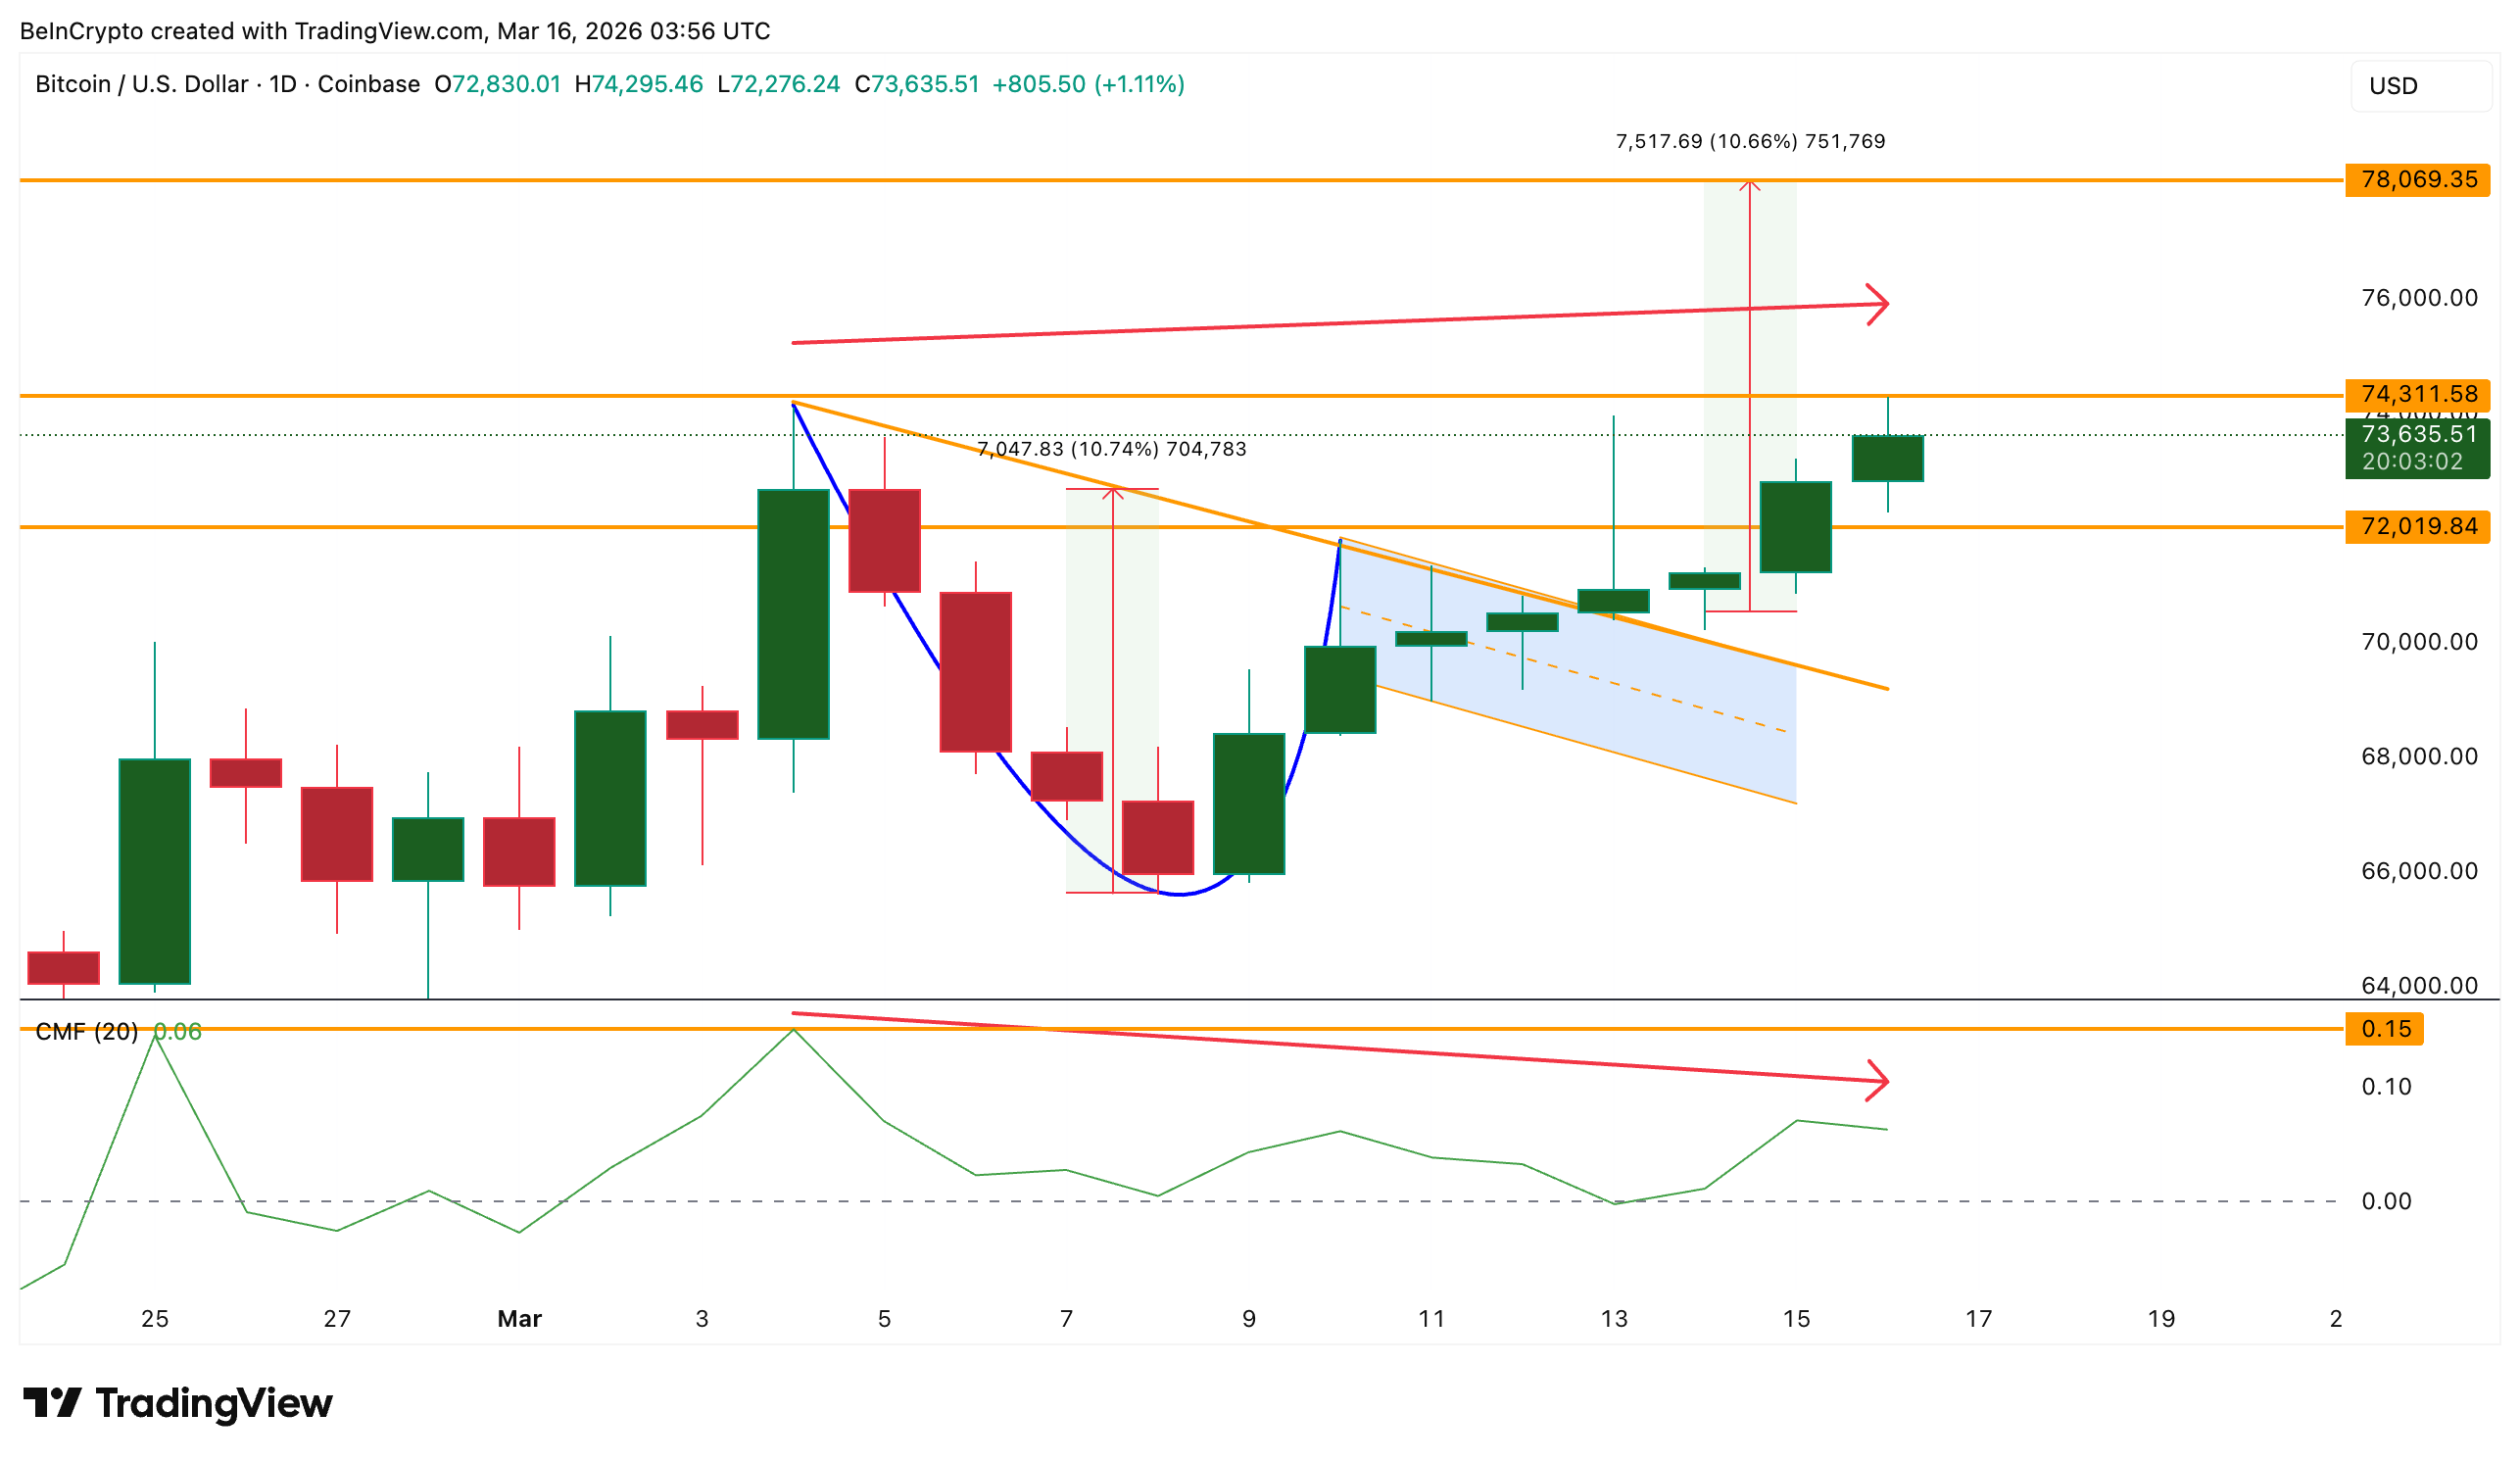 Bitcoin Price And CMF: TradingView
Importantly, CMF remains positive, which means money is still flowing into Bitcoin. However, the indicator has not yet crossed the 0.15 threshold, a level that previously marked stronger capital inflows. Until CMF pushes above that region, the divergence suggests the rally could experience temporary pullbacks or consolidation phases.
Still, capital flow indicators tell only part of the story. Looking at exchange activity provides a clearer view of how standard investors are positioning themselves.
Bitcoin Exchange Outflows Rise While Leverage Falls
One of the strongest signals supporting the rally comes from the Exchange Net Position Change metric. This indicator tracks how many coins move into or out of cryptocurrency exchanges.
On March 9, the exchange net position change showed roughly –38,412 BTC, meaning that many coins were already leaving exchanges. By March 15, the metric had dropped further to about –65,393 BTC.
That shift represents roughly a 40% increase in exchange outflows, suggesting investors have continued buying Bitcoin.
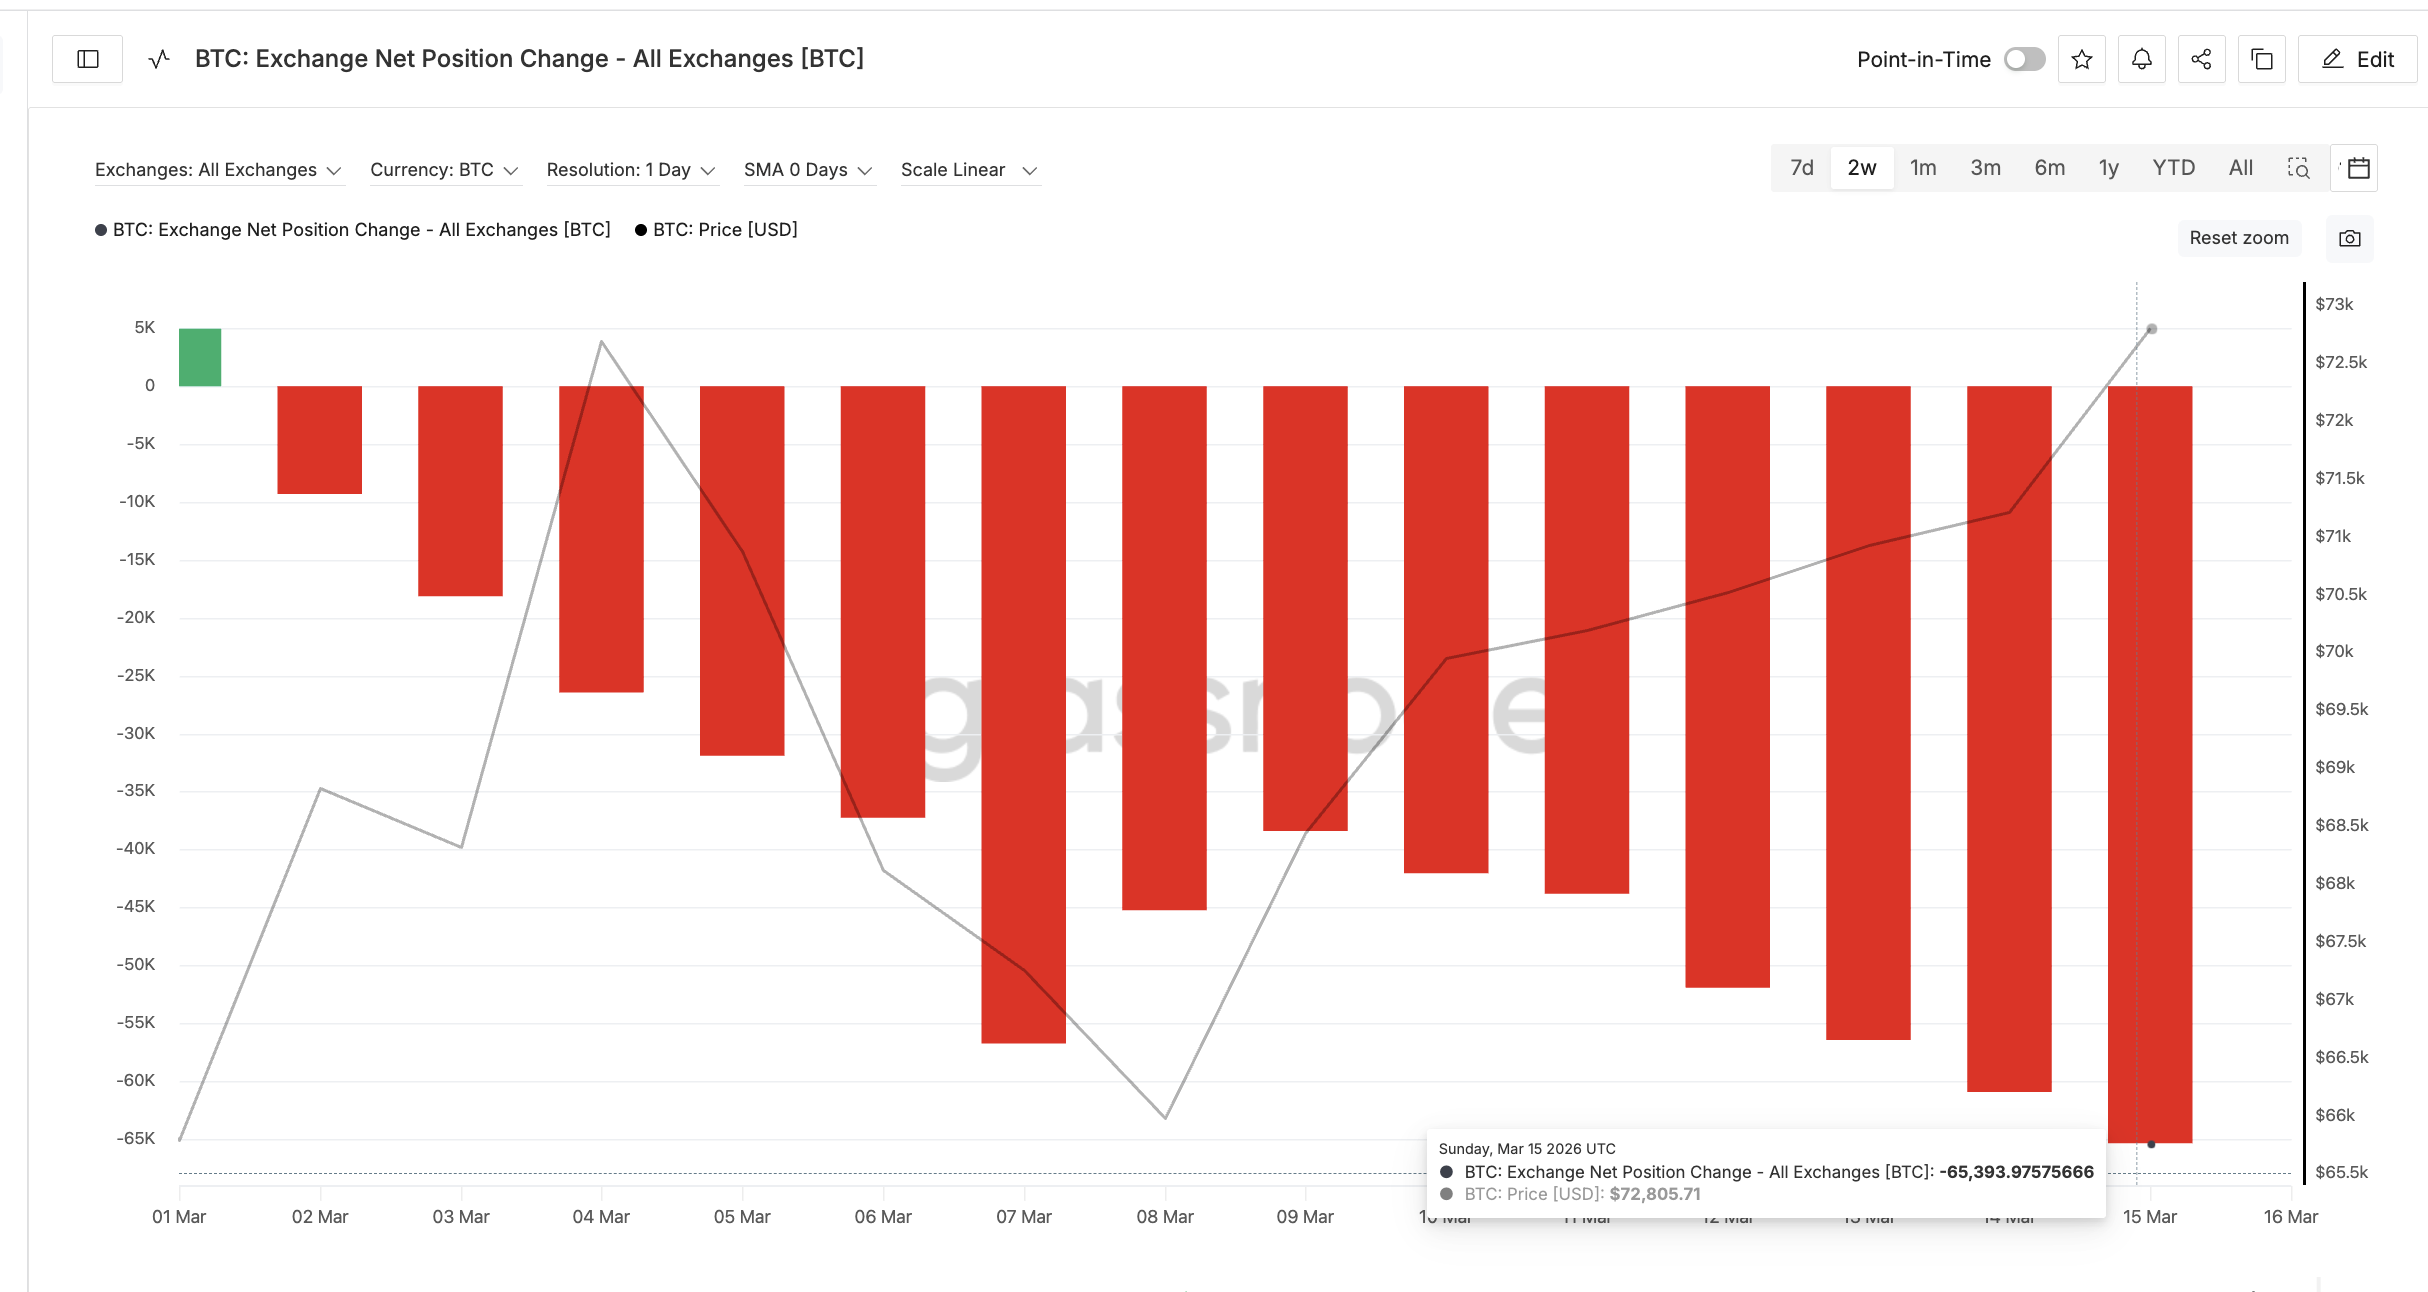 Exchange Flow: Glassnode
When fewer coins remain on exchanges, the immediate supply available for selling declines. This dynamic can support price rallies, especially when combined with strong technical breakouts. However, spot accumulation alone does not guarantee a sustained rally. The derivatives market must also support the move.
Interestingly, derivatives data show that leverage has declined even as the Bitcoin price climbed. On March 5, when Bitcoin traded near $72,600, total open interest in Bitcoin futures stood at roughly $26.14 billion.
As of March 16, the Bitcoin price moved higher to around $73,700, yet open interest dropped to approximately $22.78 billion, a decline of almost 13%.
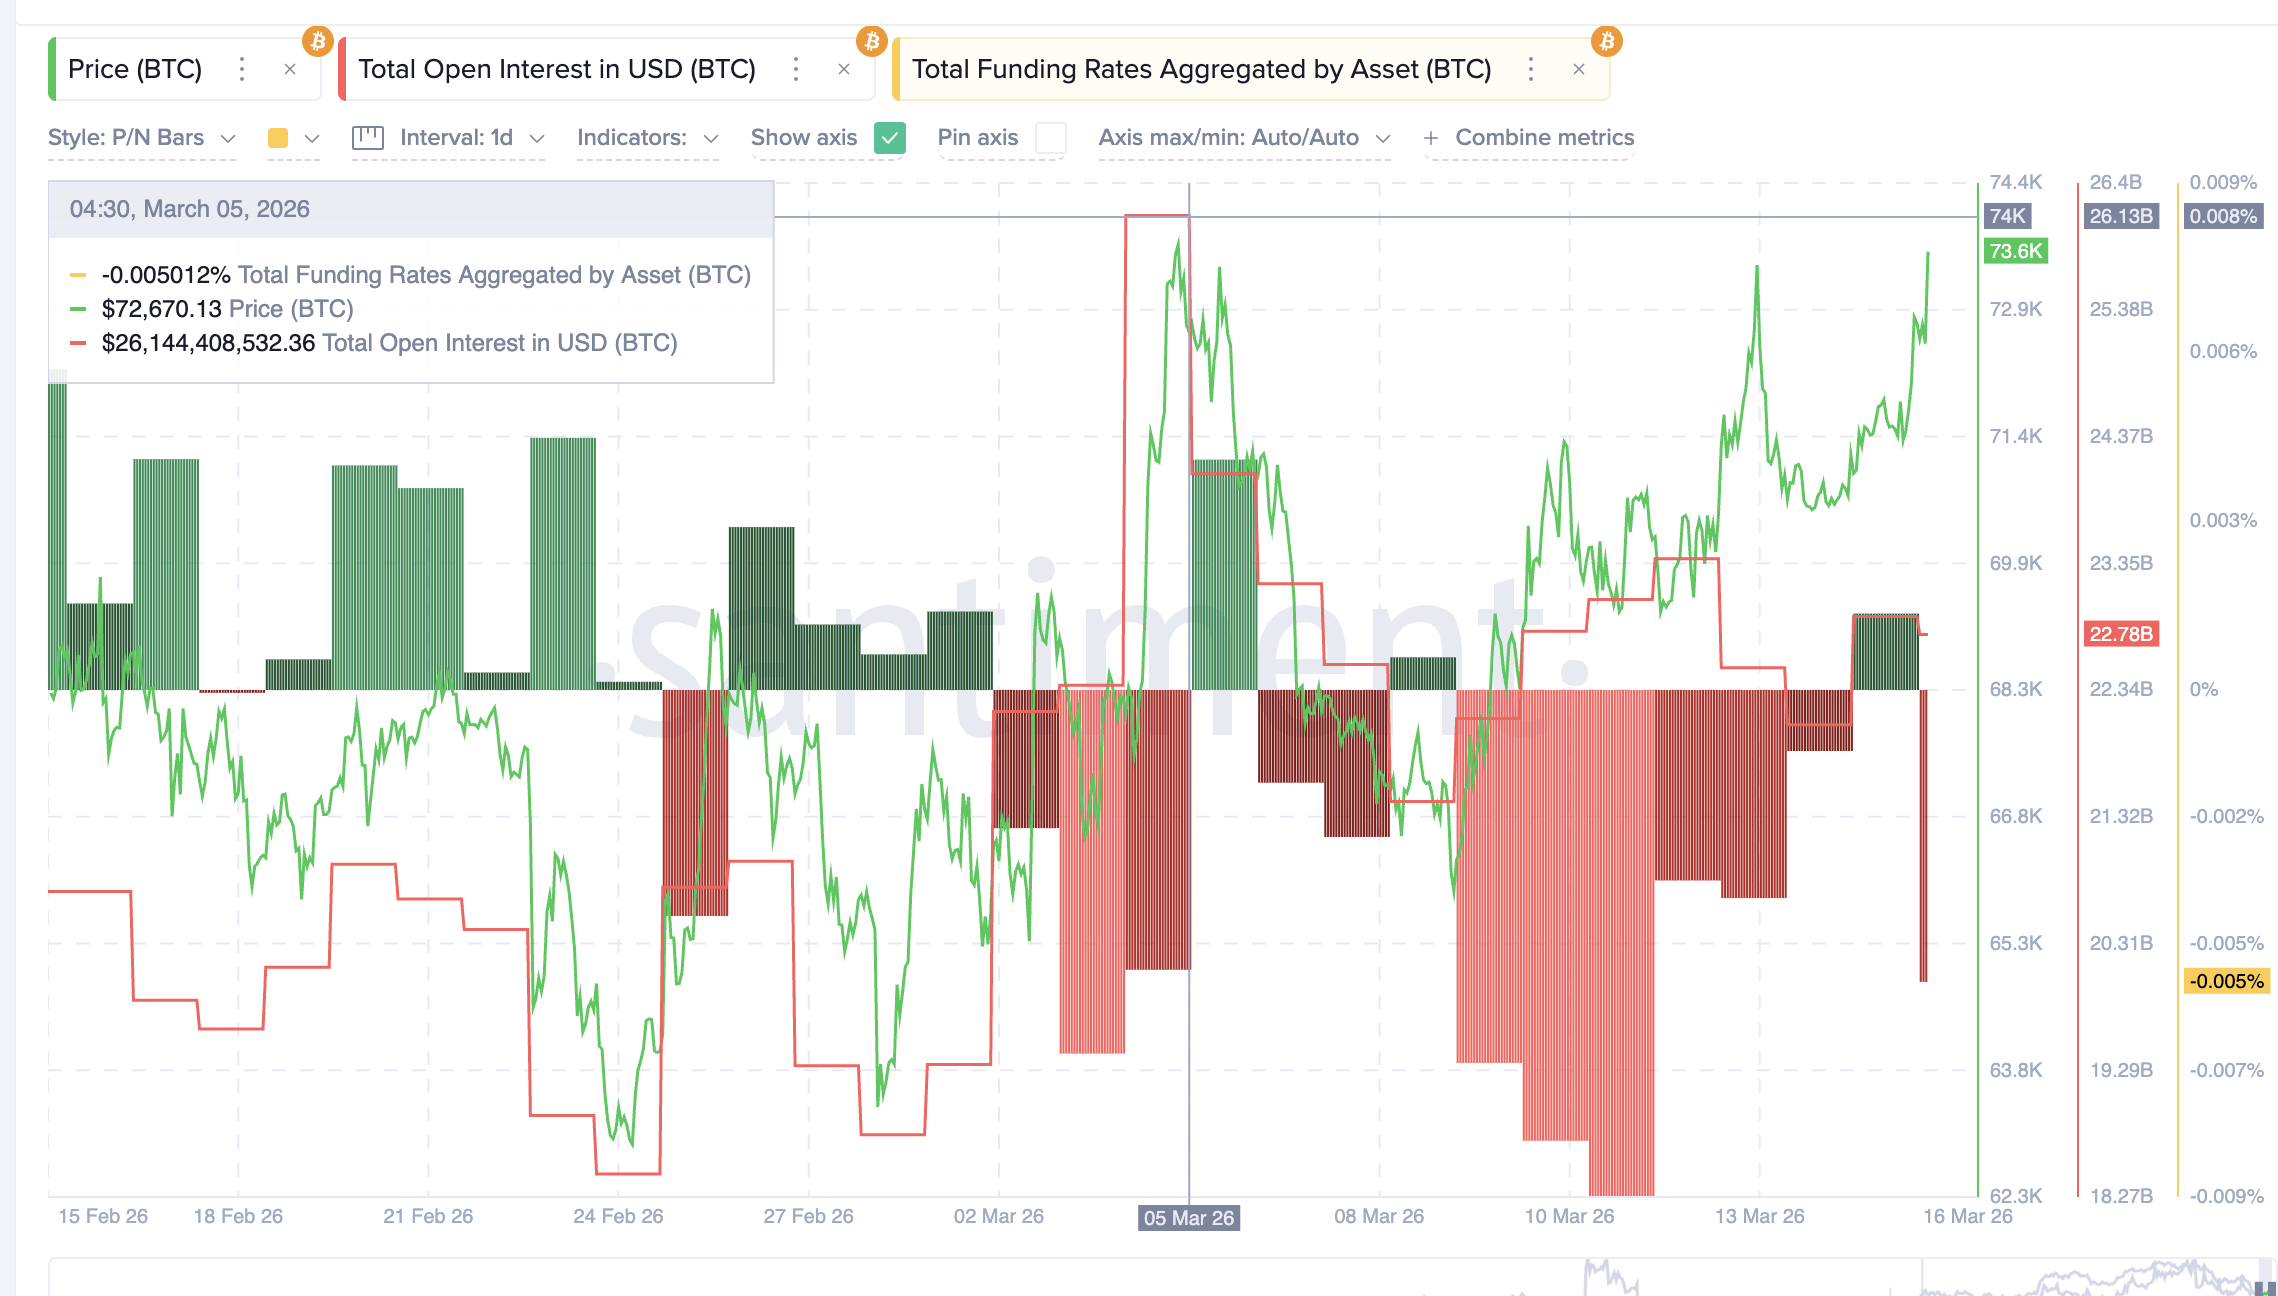 Derivatives: Santiment
Funding rates support that interpretation.
Earlier in March, funding rates were close to turning positive as traders chased the rally. Currently, funding rates have turned slightly negative (-0.005), indicating that leverage remains relatively restrained and traders are still cautious. And caution is good during rallies, as we all know what damage excessive long leverage can do.
Lower leverage reduces the risk of large liquidation cascades and can make price moves more stable. Plus, the market is not overly optimistic, as highlighted by the negative funding rate. With spot demand increasing and leverage decreasing, the broader structure of the rally appears healthier than earlier in the month.
Bitcoin Price Levels That Now Point Higher
Despite the constructive market structure, Bitcoin still needs to clear several resistance levels before the rally can extend toward the projected $78,000 target.
The first major resistance sits near $74,300, where sellers recently appeared. If Bitcoin breaks above that zone, the next key level lies above $75,100.
A clean daily close above $75,100 could confirm the breakout continuation and potentially open the path toward the $78,000–$79,000 region, which aligns with the measured move of the cup-and-handle pattern.
On the downside, the first support level appears near $72,000. If Bitcoin falls below that level, the next support zones lie around $70,400 and $68,900.
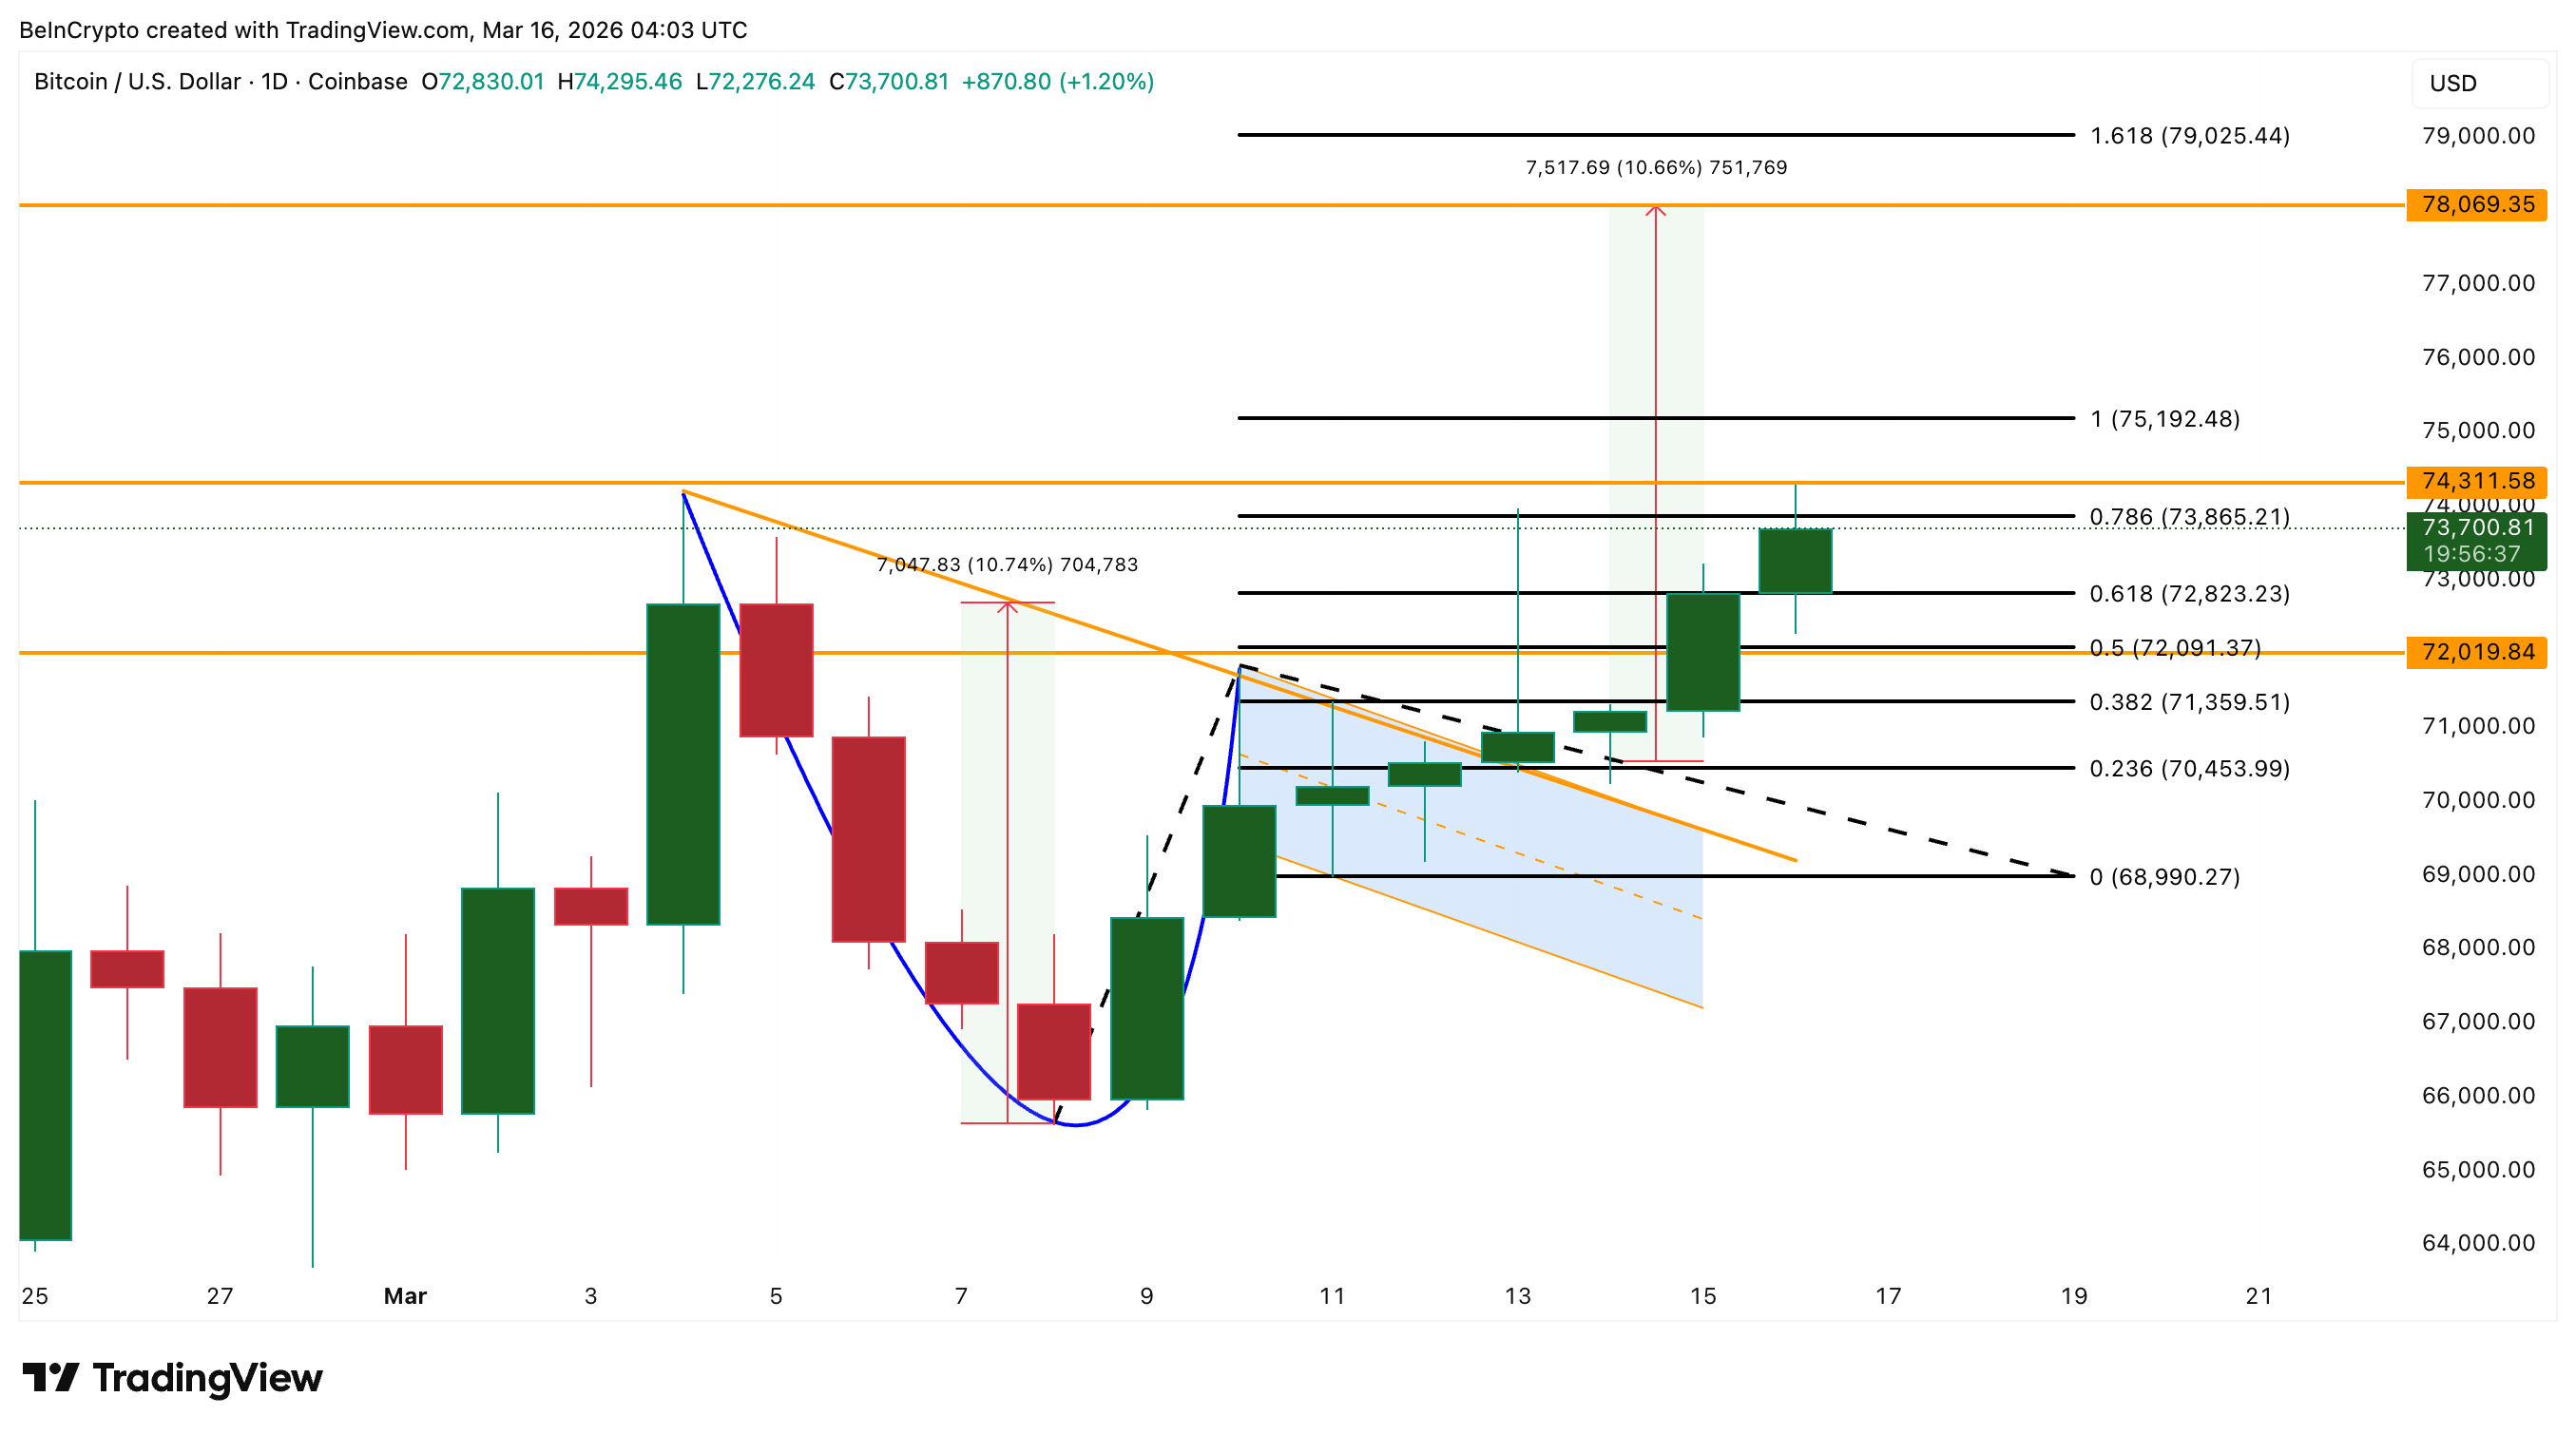 Bitcoin Price Analysis: TradingView
A drop below $68,900 would weaken the bullish breakout structure and suggest the rally may need more time to consolidate before attempting another move higher.
For now, Bitcoin price remains supported by strong spot accumulation and reduced leverage, but the market still needs to clear key resistance levels before the $78,000 target becomes firmly within reach.
0
0


 Manage all your crypto, NFT and DeFi from one place
Securely connect the portfolio you’re using to start.


0
0

0
0

0
0