
Bitcoin Price Faces August Curse After Four Straight Red Months

0
0

Bitcoin price is holding near $65,700 this week, and traders are watching the calendar as closely as the chart. That is because August has not been kind to BTC in recent memory.
Every August since 2022 has closed in the red. Not a small dip either. The average pullback lands somewhere around 19%.
Trader and chart analyst Ali (@alicharts) laid this out plainly in a recent post, and the numbers are hard to argue with.
This piece looks at what actually happened in those past Augusts, where BTC price sits today, and what a realistic BTC price prediction looks like as the month approaches.
It also breaks down a full 13-year Bitcoin price forecast dataset, since one pattern in recent Bitcoin news is rarely the whole story.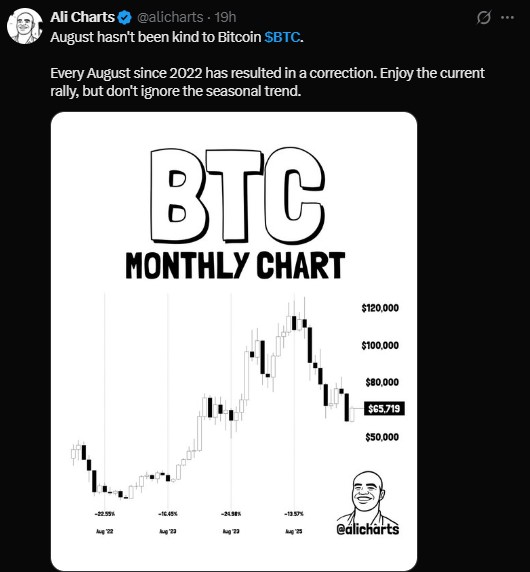
What does Bitcoin's monthly chart show about August?
The monthly candlestick chart tells a simple story. Four Augusts in a row, four red candles.
Month | Bitcoin Price Move |
August 2022 | -22.55% |
August 2023 | -16.45% |
August 2024 | -24.98% |
August 2025 | -13.57% |
That is not a coincidence traders can shrug off. Four years, four corrections, all landing between 13% and 25%. It is one of the more consistent seasonal patterns in the Bitcoin price chart.
Nobody knows for certain why August tends to hurt. Some point to thin summer trading volume in the US and Europe, which can make price swings sharper.
Others say it is simply where Bitcoin sat in its broader cycle each of those years. Both things can be true at once.
Where does Bitcoin price stand right now?
As of late July 2026, BTC price is trading around $65,700, based on the latest chart data. That is down from highs above $120,000 reached earlier in the cycle, according to the monthly chart shared by Ali.
Derivatives data adds more color. BTC futures volume over 24 hours sits near $48.17 billion, up close to 10% on the day. Open interest is holding around $49.01 billion, roughly flat.
The long/short ratio on major exchanges leans bullish. Binance shows a ratio near 1.86, and OKX sits close to 1.72. That means more traders are positioned long than short right now, even with the seasonal warning hanging over the market.
Liquidation data shows the risk cuts both ways. Over the past 24 hours, long liquidations reached $67.07 million, far outpacing short liquidations of $13.23 million. That tells us leveraged long positions have already been tested this week.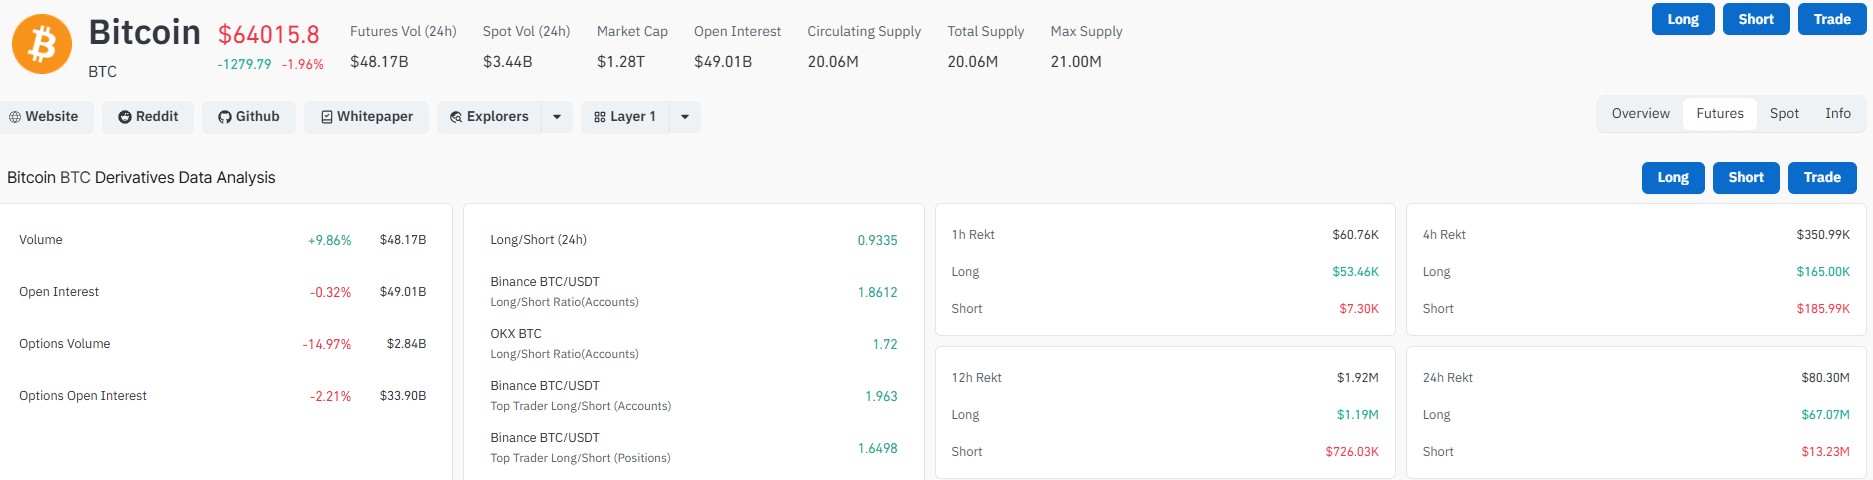
Is Bitcoin price still in a broader uptrend despite August risk?
Zooming out, the monthly chart still shows a structure of higher highs since the 2022 bottom near $18,000-$20,000. Each August pullback so far has happened inside a longer uptrend, not at the start of a new downtrend.
That does not guarantee this August plays out the same way. Past performance is exactly that, past. But the pattern is strong enough that many traders are trimming leverage and tightening stop losses heading into the month.
Support levels worth watching sit near $63,200 and then $61,000, based on recent price action.
A break below those levels on high volume would echo the sharper corrections seen in 2022 and 2024.
On the upside, a reclaim of the $70,000 zone would weaken the seasonal bear case fast.
What does the full Bitcoin price history say about August?
Zooming out to 13 years of data changes the picture a little, and this is where a real Bitcoin price forecast needs more than just the last four years.
Coinglass data going back to 2013 shows August has closed red in 9 of the last 13 years. The average monthly return for August across that stretch is -3.08%, and the median is -7.49%.
Year | August Return |
2025 | -6.49% |
2024 | -8.6% |
2023 | -11.29% |
2022 | -13.88% |
2021 | +13.8% |
2020 | +2.83% |
2019 | -4.6% |
2018 | -9.27% |
2017 | -7.44% |
2016 | -7.49% |
2015 | -18.67% |
2014 | -17.55% |
2013 | +30.42% |
So the four-year red streak from 2022 to 2025 is real, but it sits inside a longer pattern that already leaned bearish for August. Out of 13 years, only 2013, 2020, and 2021 closed green.
This matters for anyone building a Bitcoin price prediction around seasonality. The edge is there, but it is not a lock. Roughly 1 in 4 Augusts has still ended higher, including one of the best months in Bitcoin's history back in 2013.
For comparison, October tells almost the opposite story. The average return for October sits at +19.92%, with a median of +8.81%, making it one of the strongest months on the calendar.
That contrast is part of why seasoned traders treat monthly Bitcoin price forecast talk as a probability, not a promise.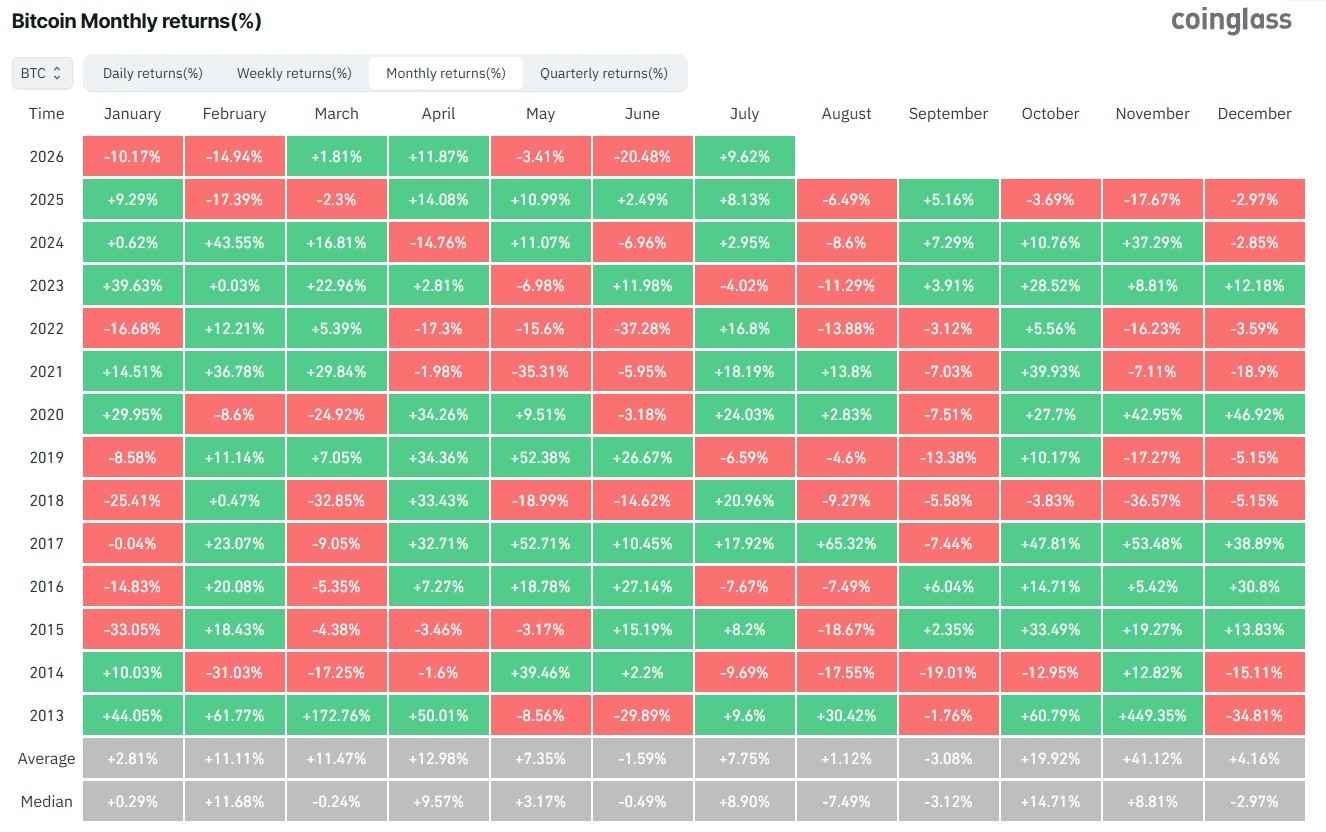
What should traders watch this August?
Three things tend to matter most going into a seasonally weak month: spot ETF flows, funding rates on futures, and overall market liquidity.
If ETF inflows stay soft and funding rates get too crowded on the long side, the setup for another red August starts to look familiar.
If inflows pick back up and long positioning cools off, Bitcoin price could be the one to finally break the streak.
Either way, the message from over a decade of data is simple. August has earned its reputation, even if it is not undefeated. Ignoring that history, especially during a rally, is where a lot of traders get caught off guard.
For now, the most balanced BTC price forecast treats August as a month to manage risk, not a month to panic. Keep an eye on Bitcoin news around ETF flows and Fed policy this week, since those headlines tend to move the needle more than the calendar alone.
Disclaimer
This article is for informational purposes only and does not constitute financial, investment, or trading advice. Past price performance, including seasonal patterns, does not guarantee future results. Always do your own research and consult a licensed financial advisor before making any investment decisions.
0
0


 Manage all your crypto, NFT and DeFi from one place
Securely connect the portfolio you’re using to start.

0
0

0
0

0
0

0
0