Why Is the US Stock Market Down Today?

0
0

The S&P 500 is grinding toward its most critical technical level at 6,770 as the US stock market selloff extends another day. With 72% of stocks declining, the VIX crossing above 25, and pressure mounting from oil, a strengthening dollar, and hot labor data, the damage is broad-based.
Energy is the lone holdout while basic materials and financials, led by Morgan Stanley’s 3.25% drop on layoff news, are dragging the index lower. Here is how it is all connected.
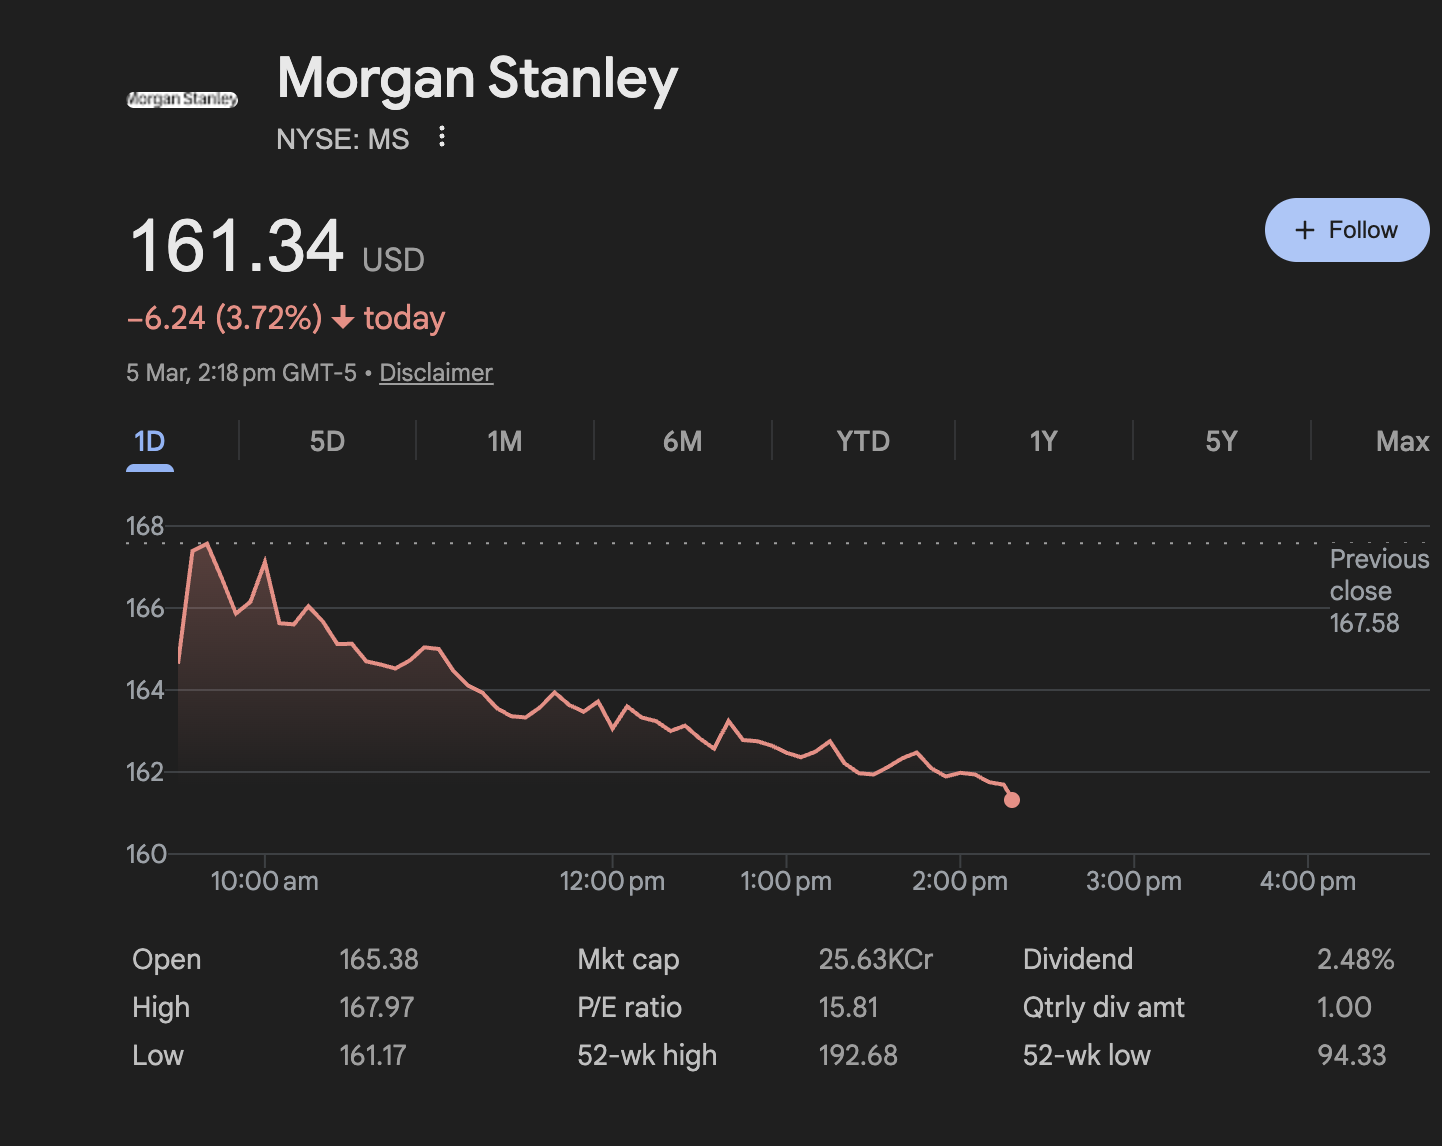 Morgan Stanley Price: Google
Top US Stock Market News:
- Oracle May Cut 30,000 Jobs To Fund AI Buildout: US banks have pulled back from lending and doubled Oracle’s borrowing costs since September.
The company is considering selling Cerner and now demands 40% upfront deposits from new customers to fund data center capacity.
- Traders Flip To ECB Hike Bets As Energy Shock Hits Europe: Markets are now pricing a 60%+ chance of an ECB rate hike this year, reversing last Friday’s 40% odds of a cut.
Oil has surged 20% this week due to the Middle East conflict. And the Fed-ECB policy divergence is adding currency volatility across risk assets.
- China Sets Lowest GDP Target Since 1991 At 4.5–5%: Fixed-asset investment fell 3.8% last year while real estate plunged 17.2%.
Beijing is prioritizing tech self-reliance over consumer spending. Additionally, the absence of aggressive stimulus is expected to weigh on global commodity demand and emerging markets.
Sentiment Cracks as Broad Selloff Extends
The damage is spreading. At press time, 72.1% of stocks are declining. The Bull/Bear gauge has deteriorated to 54/46 from Monday’s 64% bull reading, and 61% of stocks are now trading below their 50-day moving average, a growing sign of weakness.The Dow is down 1.90% to 47,811, the S&P 500 is off 1.08% to 6,795 at the time of capture. The Nasdaq has shed 0.93% to 22,595, and the Russell 2000 (the small-cap space) is leading the pain at -2.43%.
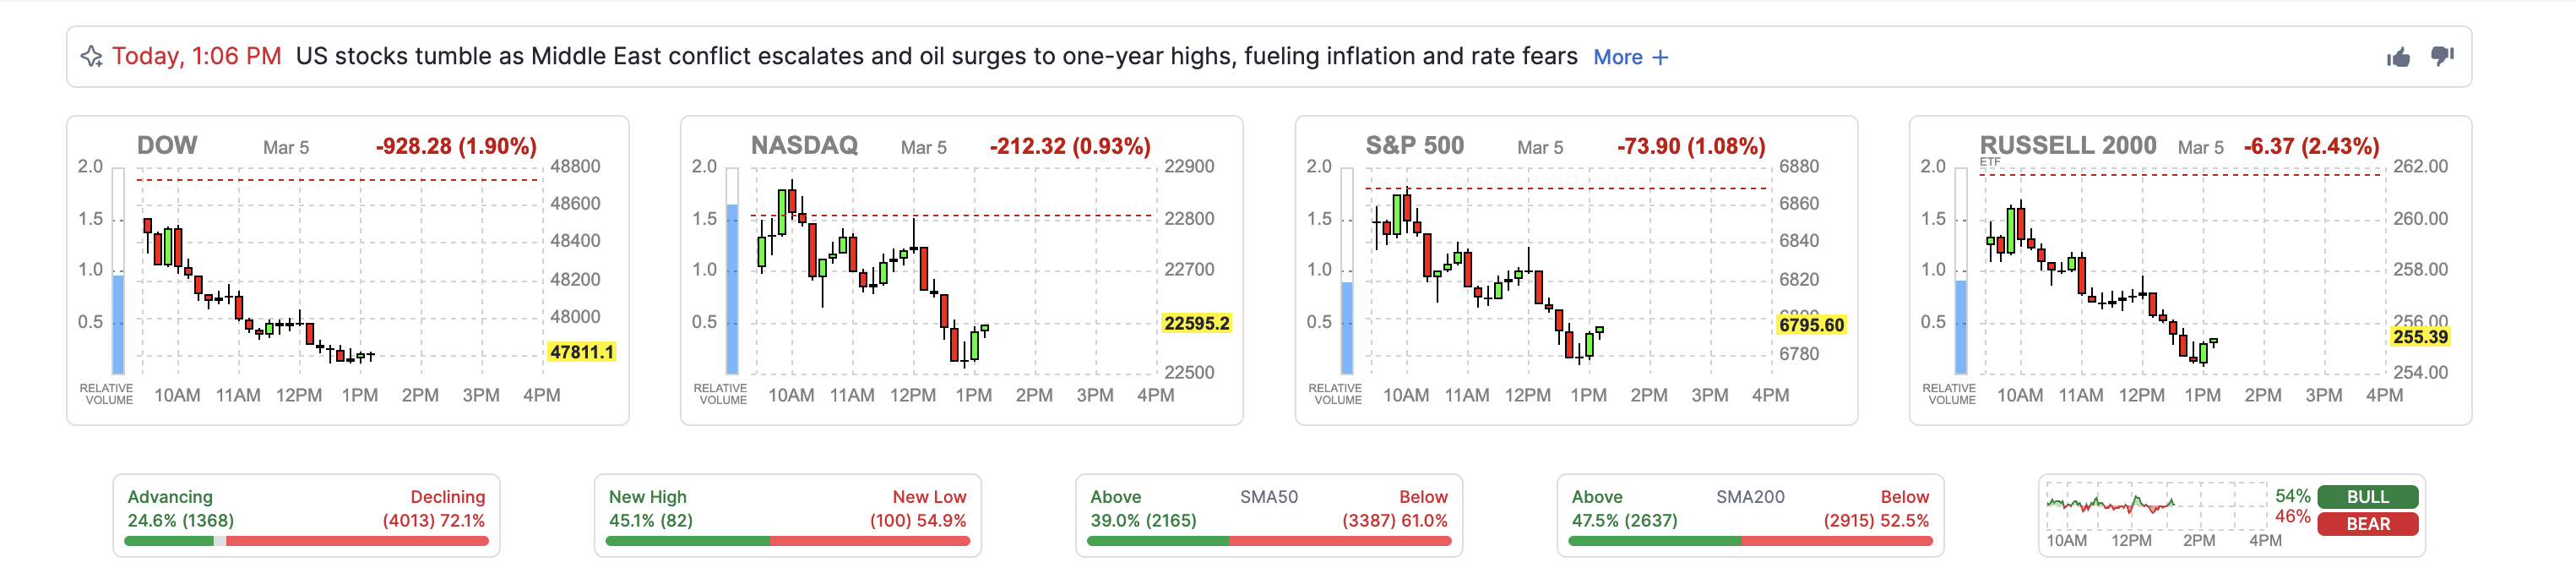 US Stock Market Pulse: FinViz
The tell: small caps were lagging the selloff on Monday despite worse macro conditions. Today, they are leading it. That rotation from large-cap institutional de-risking into broad-based selling, combined with bulls retreating 10 points (bull-bear gauge) in three sessions, suggests the complacency flagged earlier this week is heading downward.
Oil snapped back to $85 Brent earlier after yesterday’s dip, before pulling back to $80 at press time.
S&P 500 Slides Toward the Neckline, and This Time, Buyers Aren’t Showing Up
The S&P 500 is trading at 6,777 at press time, down 1.34% from yesterday’s close. The index is now inches away from the 6,770 head and shoulders neckline that we have been tracking since last week.
On March 3, the index briefly broke below the neckline to 6,710 before buyers stepped in. Today’s candle does not have that same long wick: buying pressure is visibly absent.
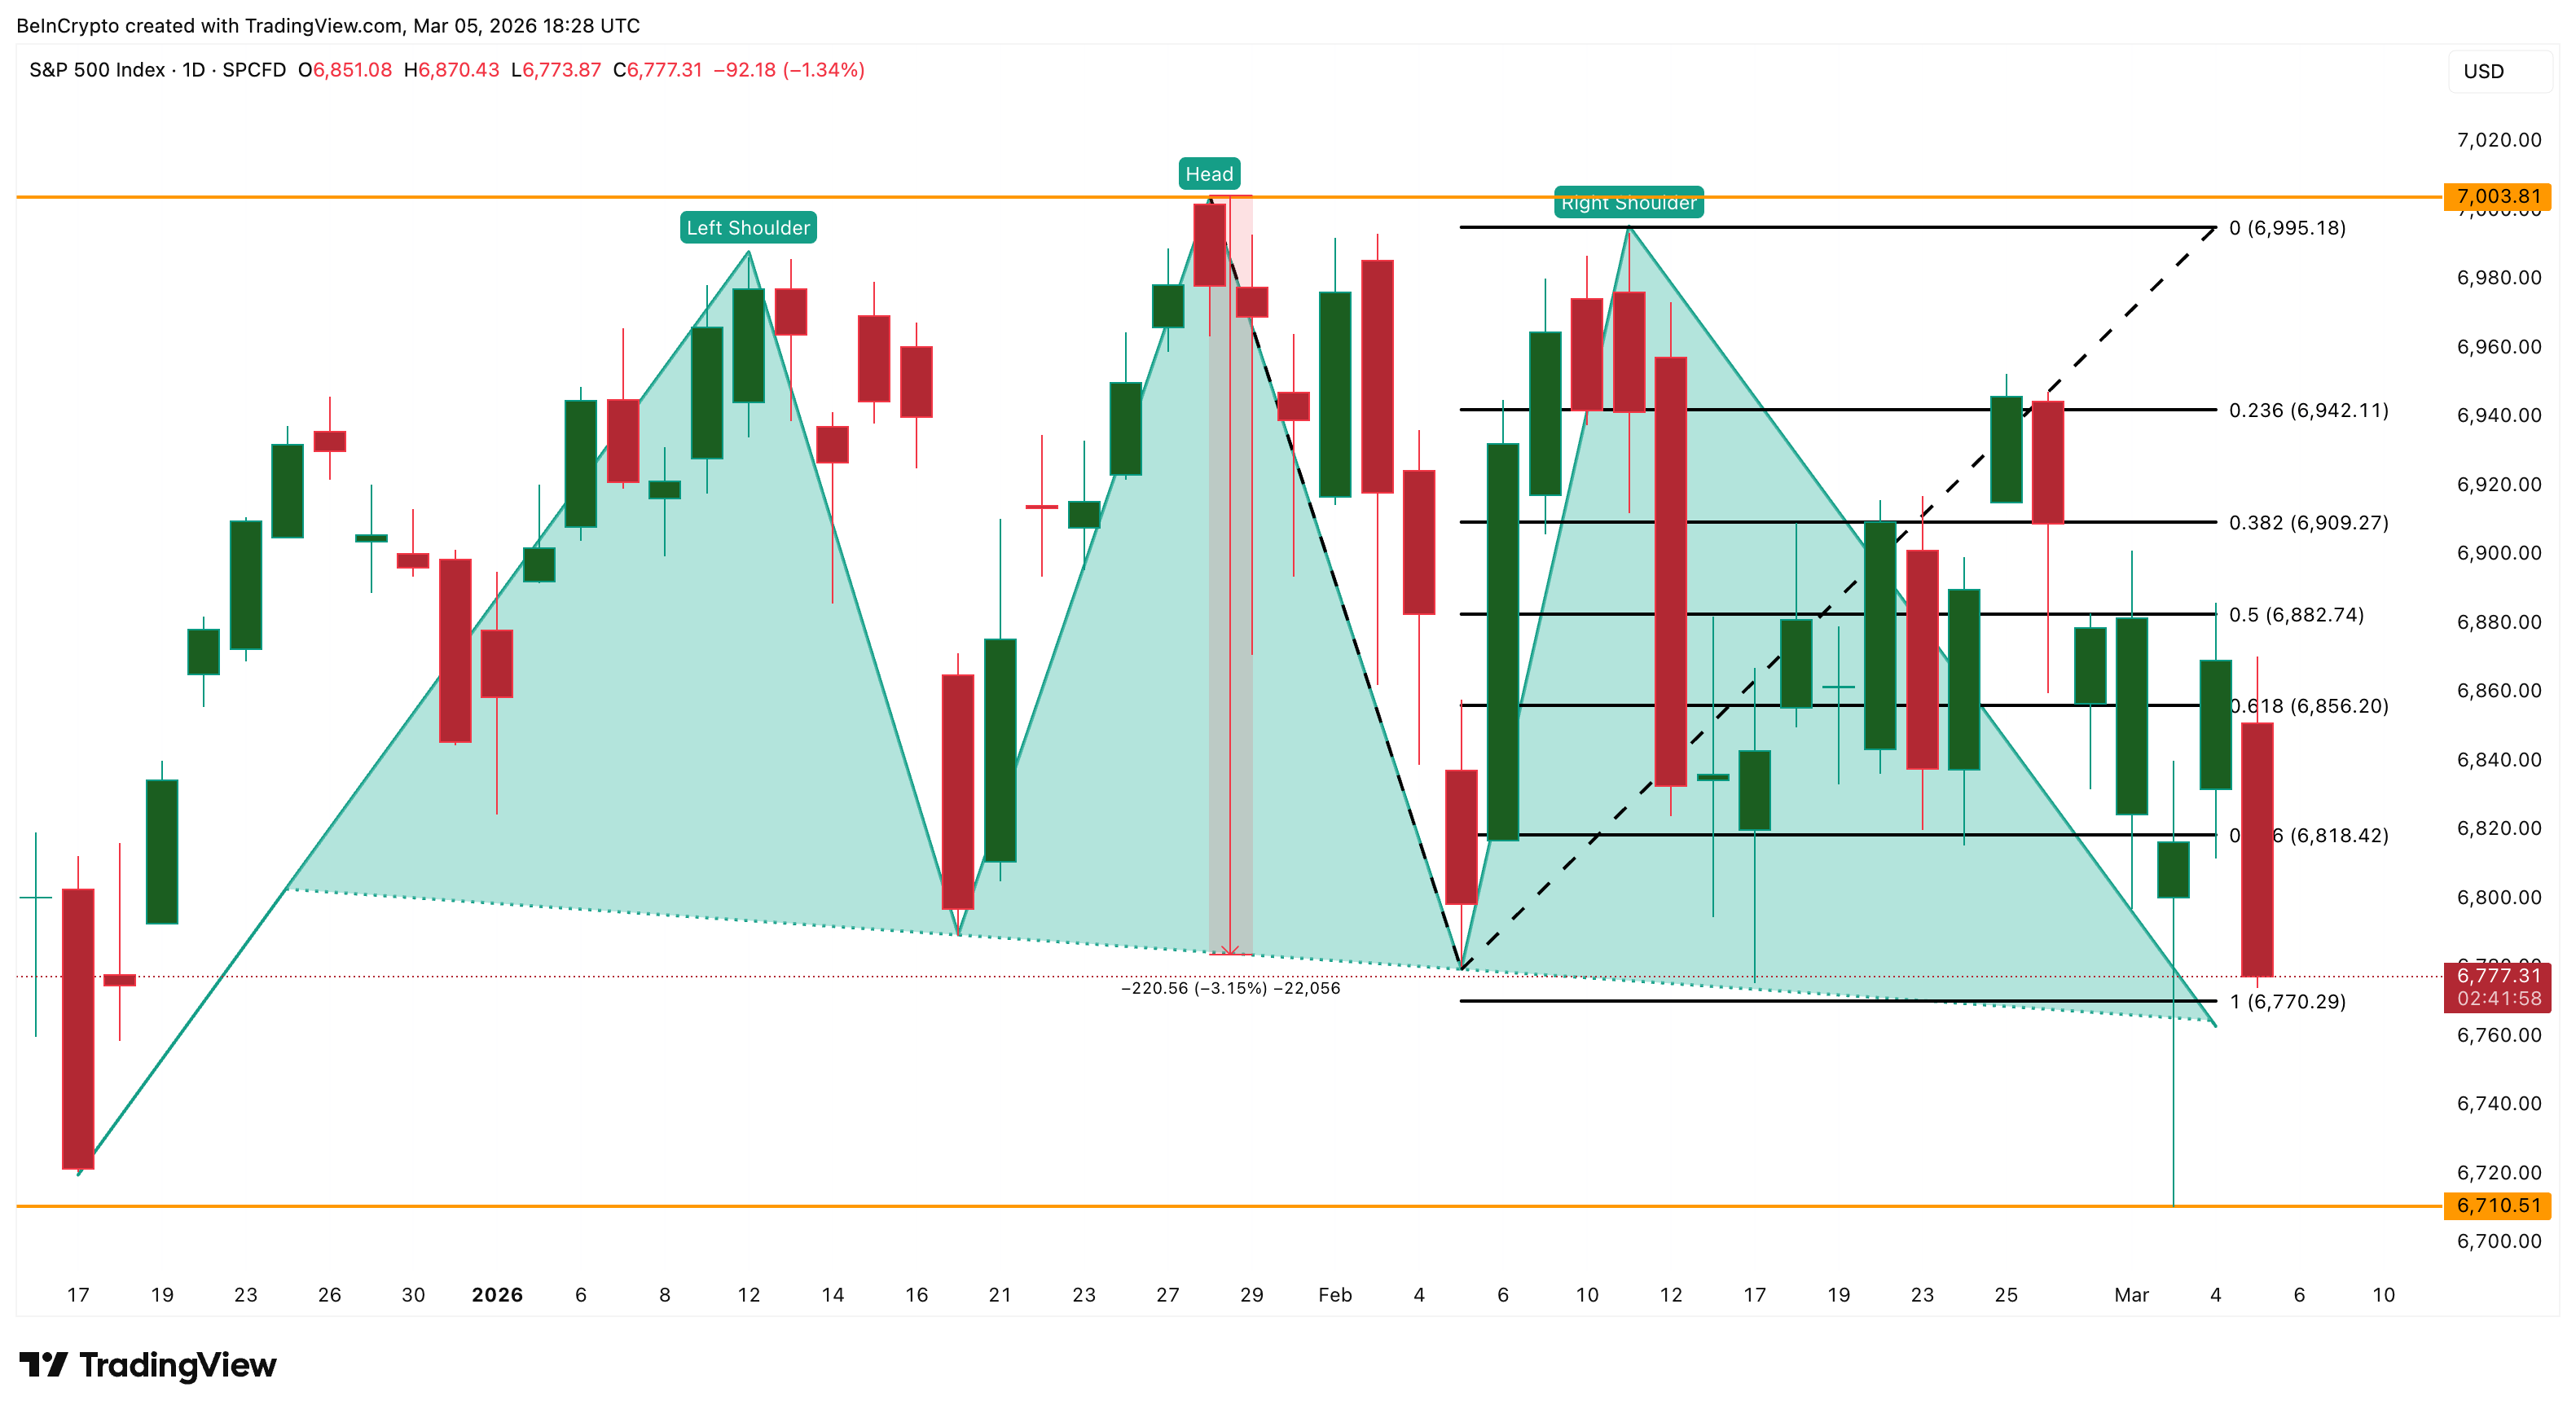 S&P 500 Analysis: TradingView
A daily close below 6,770 confirms the head and shoulders breakdown and activates the downside. If the S&P manages to hold above 6,770 into the close, there is still room for a better open tomorrow, but bulls need to reclaim 6,810 to regain any meaningful footing.
The pressure is coming from multiple directions at once. Oil is back above $80 Brent at press time after Iran struck a tanker, and that is feeding directly into the inflation chain.
Unit labor costs printed at 2.8% today (for Q4 2025) against 2.0% expected. Hourly compensation is running at 5.7%, and import prices rose 0.2%. Sticky wages plus surging energy costs are pushing the 10-year Treasury yield up to 4.14%, confirming that the bond market is pricing in persistent inflation. That keeps the rate cut narrative out.
The DXY (US Dollar Index) at 99.283, up 0.52%, tells the same story.
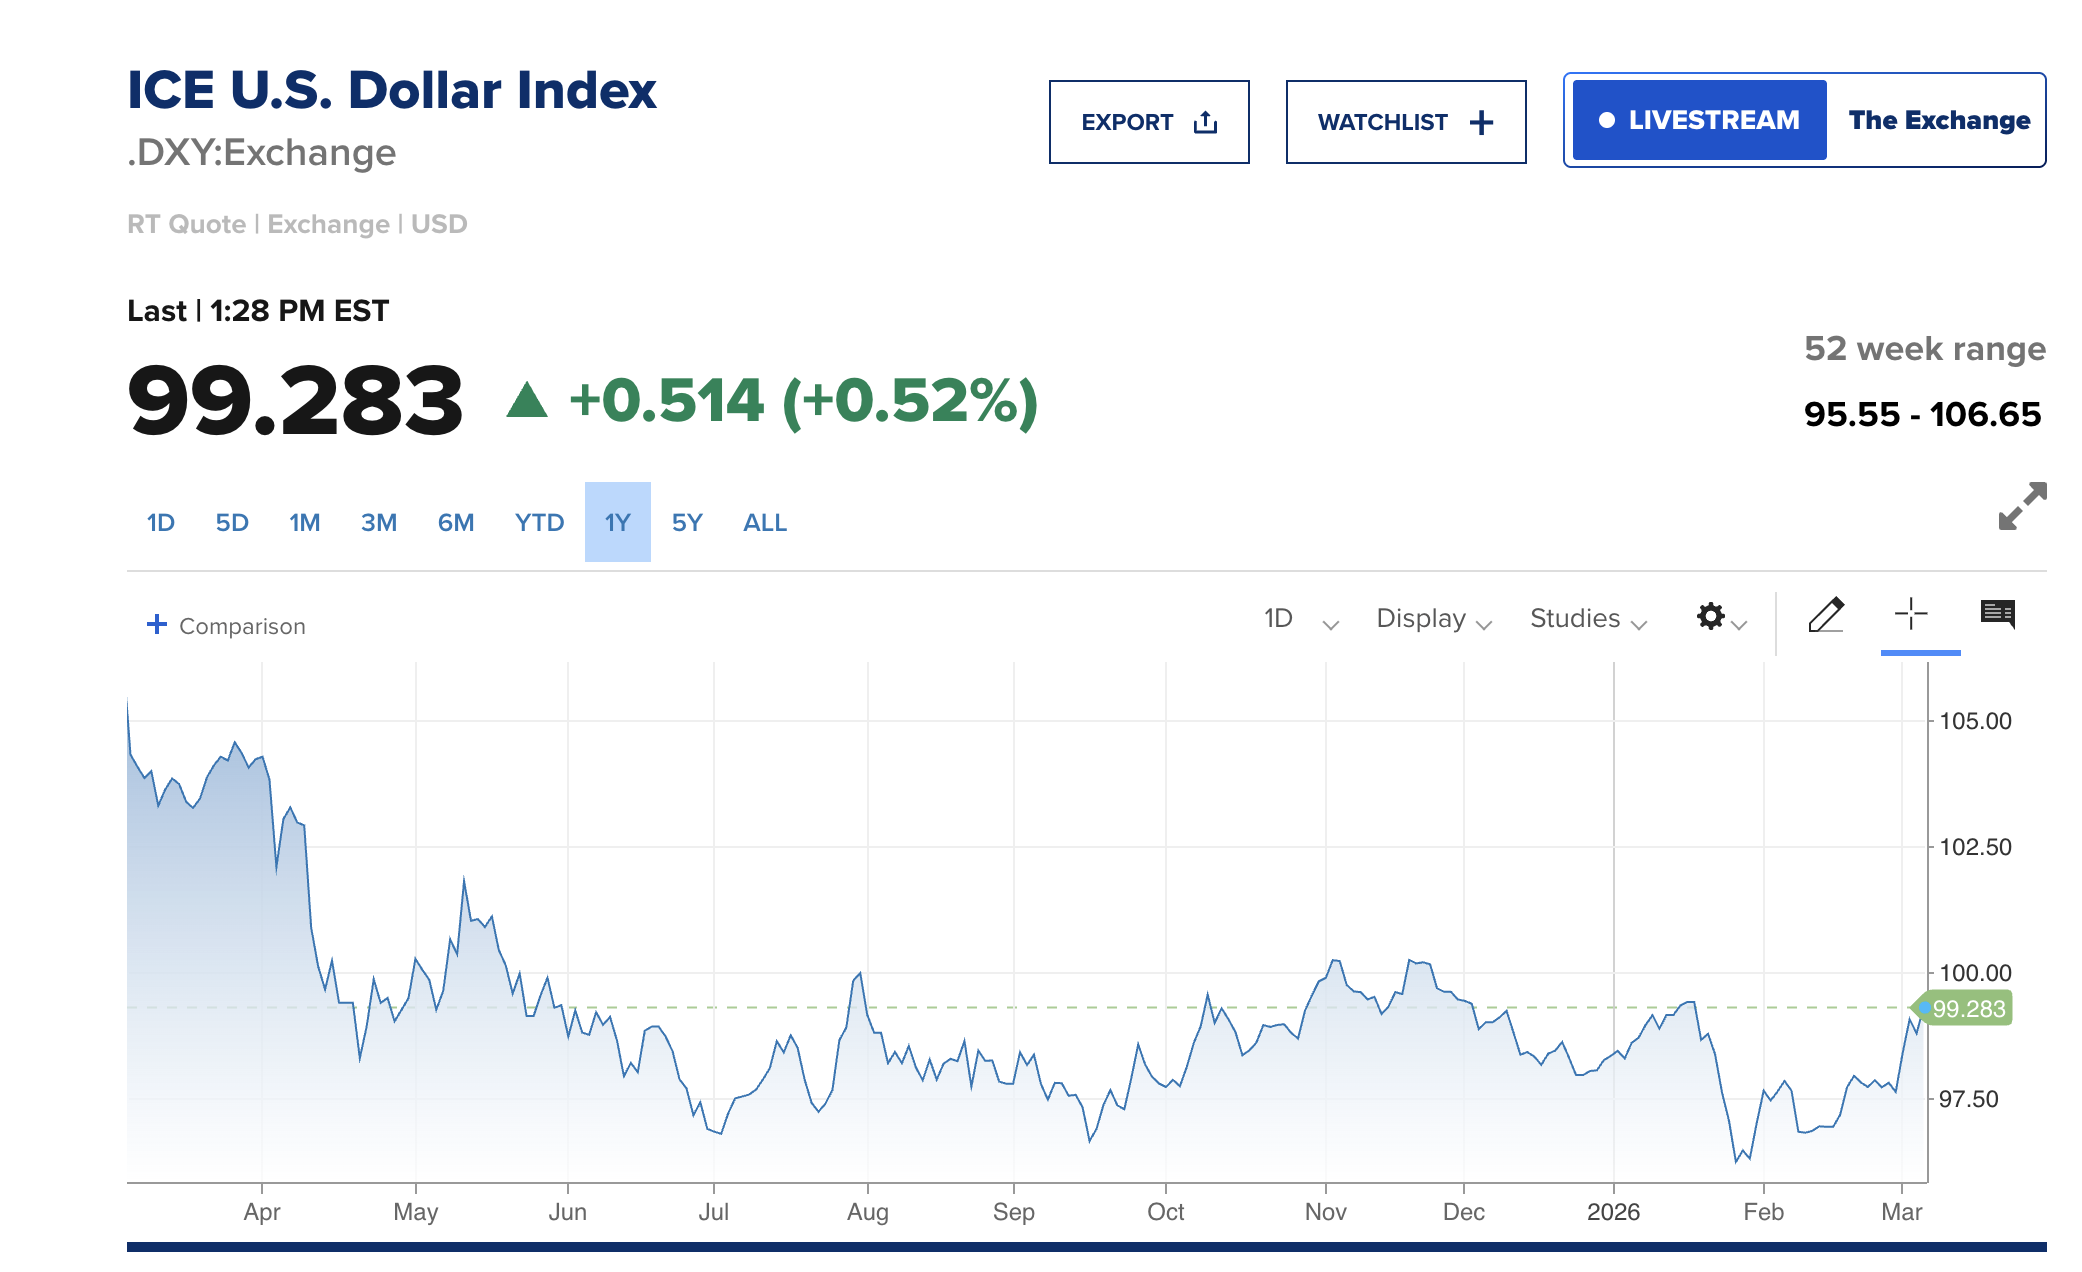 Dollar Index: CNBC
Oil surges, inflation expectations rise, the dollar strengthens, and equities come under pressure from the same source. Today, the dollar is arguably doing more damage than the VIX, although the VIX itself has surged 18.68% to 25.10.
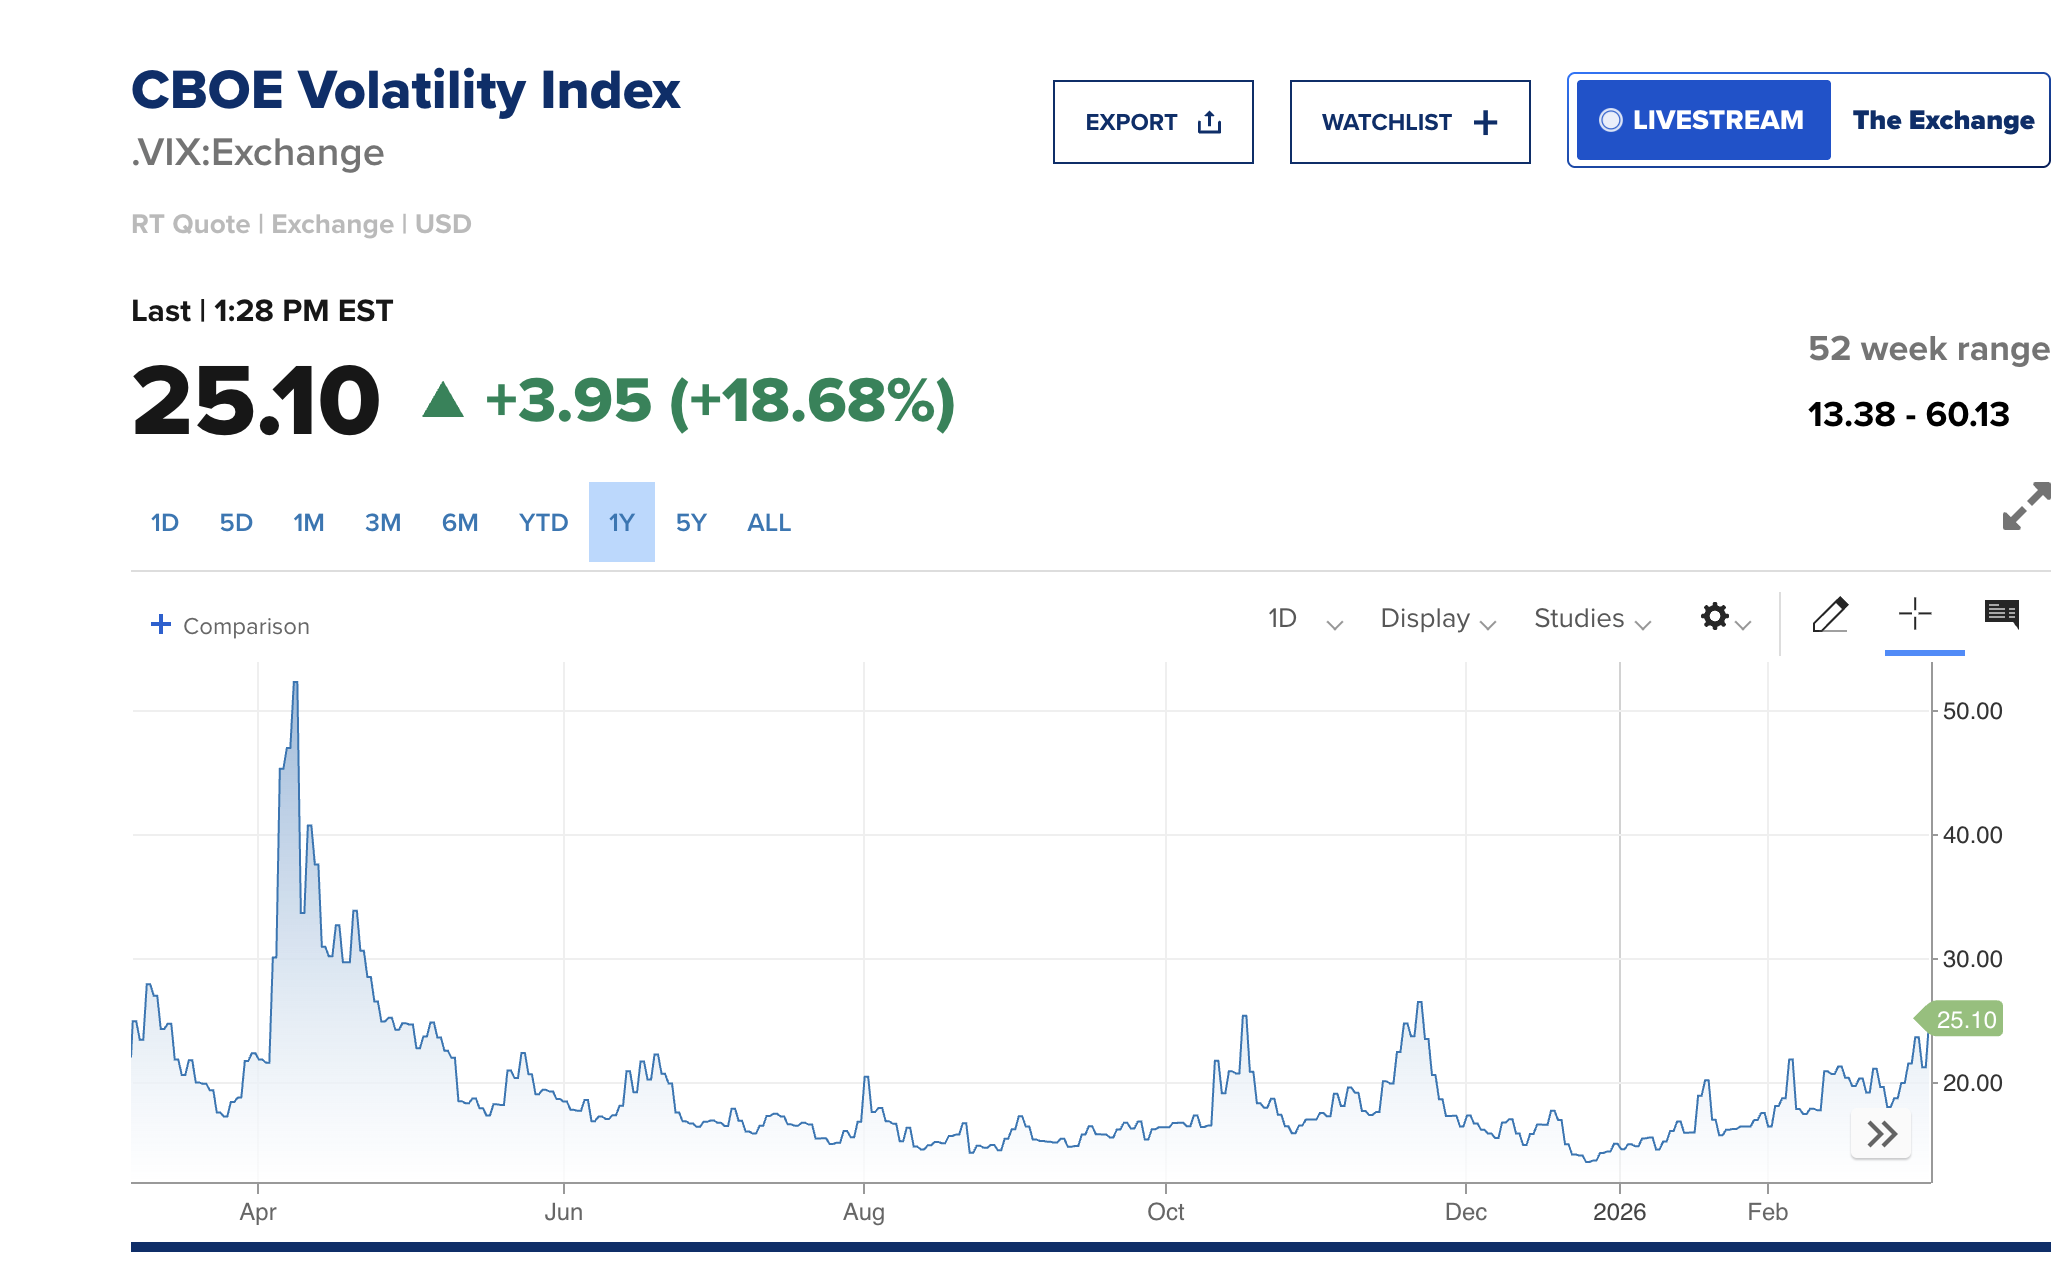 VIX Index: CNBC
Adding to the pressure on tech specifically, the Trump administration is preparing a rule that would restrict AI chip exports globally without US approval.
Energy Holds Its Ground While Basic Materials Space Takes the Biggest Hit
Every US stock market sector is red, but the spread between the strongest and weakest is telling. The Energy Select Sector SPDR Fund (XLE) is down just 0.24%, the best performer on the day.
The Materials Select Sector SPDR Fund (XLB) is hit the worst. It is down 4.24% at its lows and currently 2.08% lower from yesterday’s close.
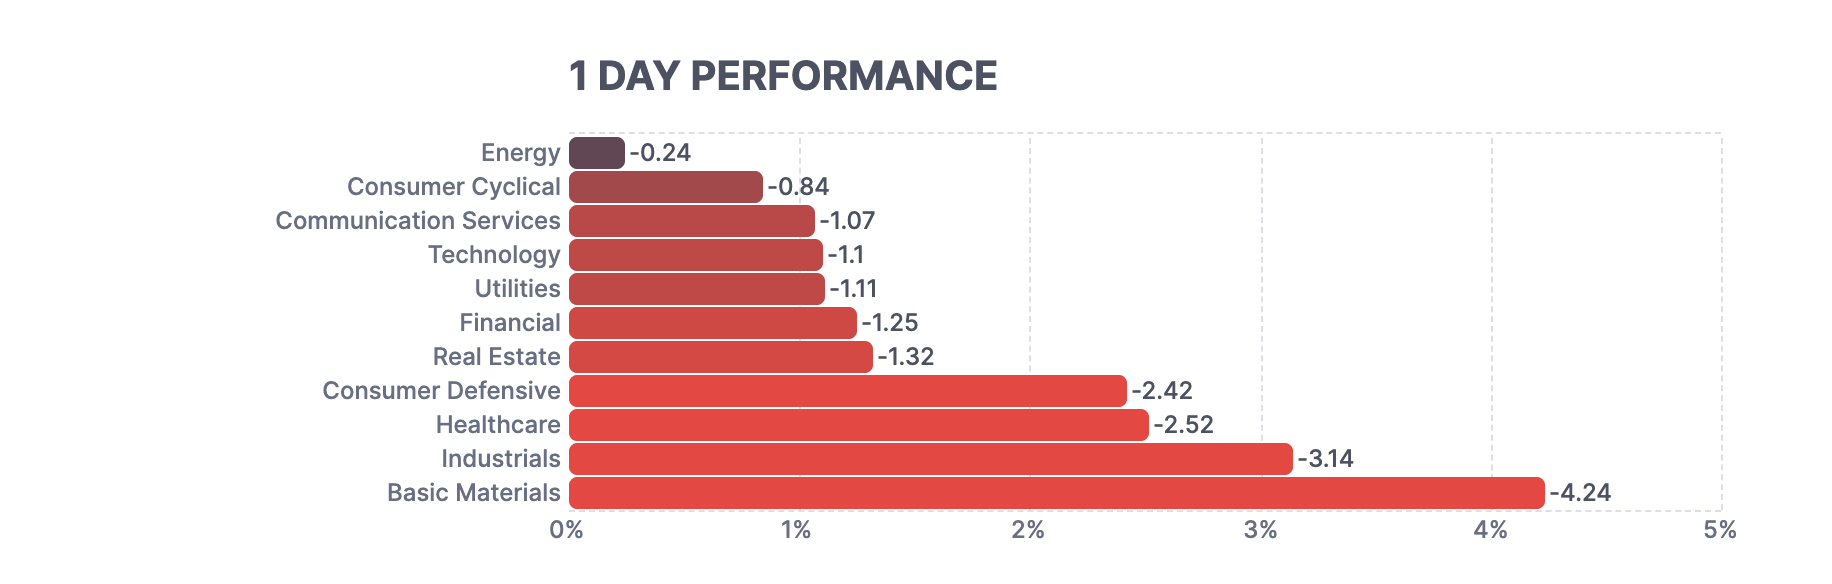 Sector Map: FinViz
XLE’s resilience is backed by structure and flows. The ETF broke out of a bull flag pattern on February 25 and is currently trading at $56, holding well above the key $54 support. The pattern stays valid as long as XLE remains above $50, and the measured move points toward $59–$60.
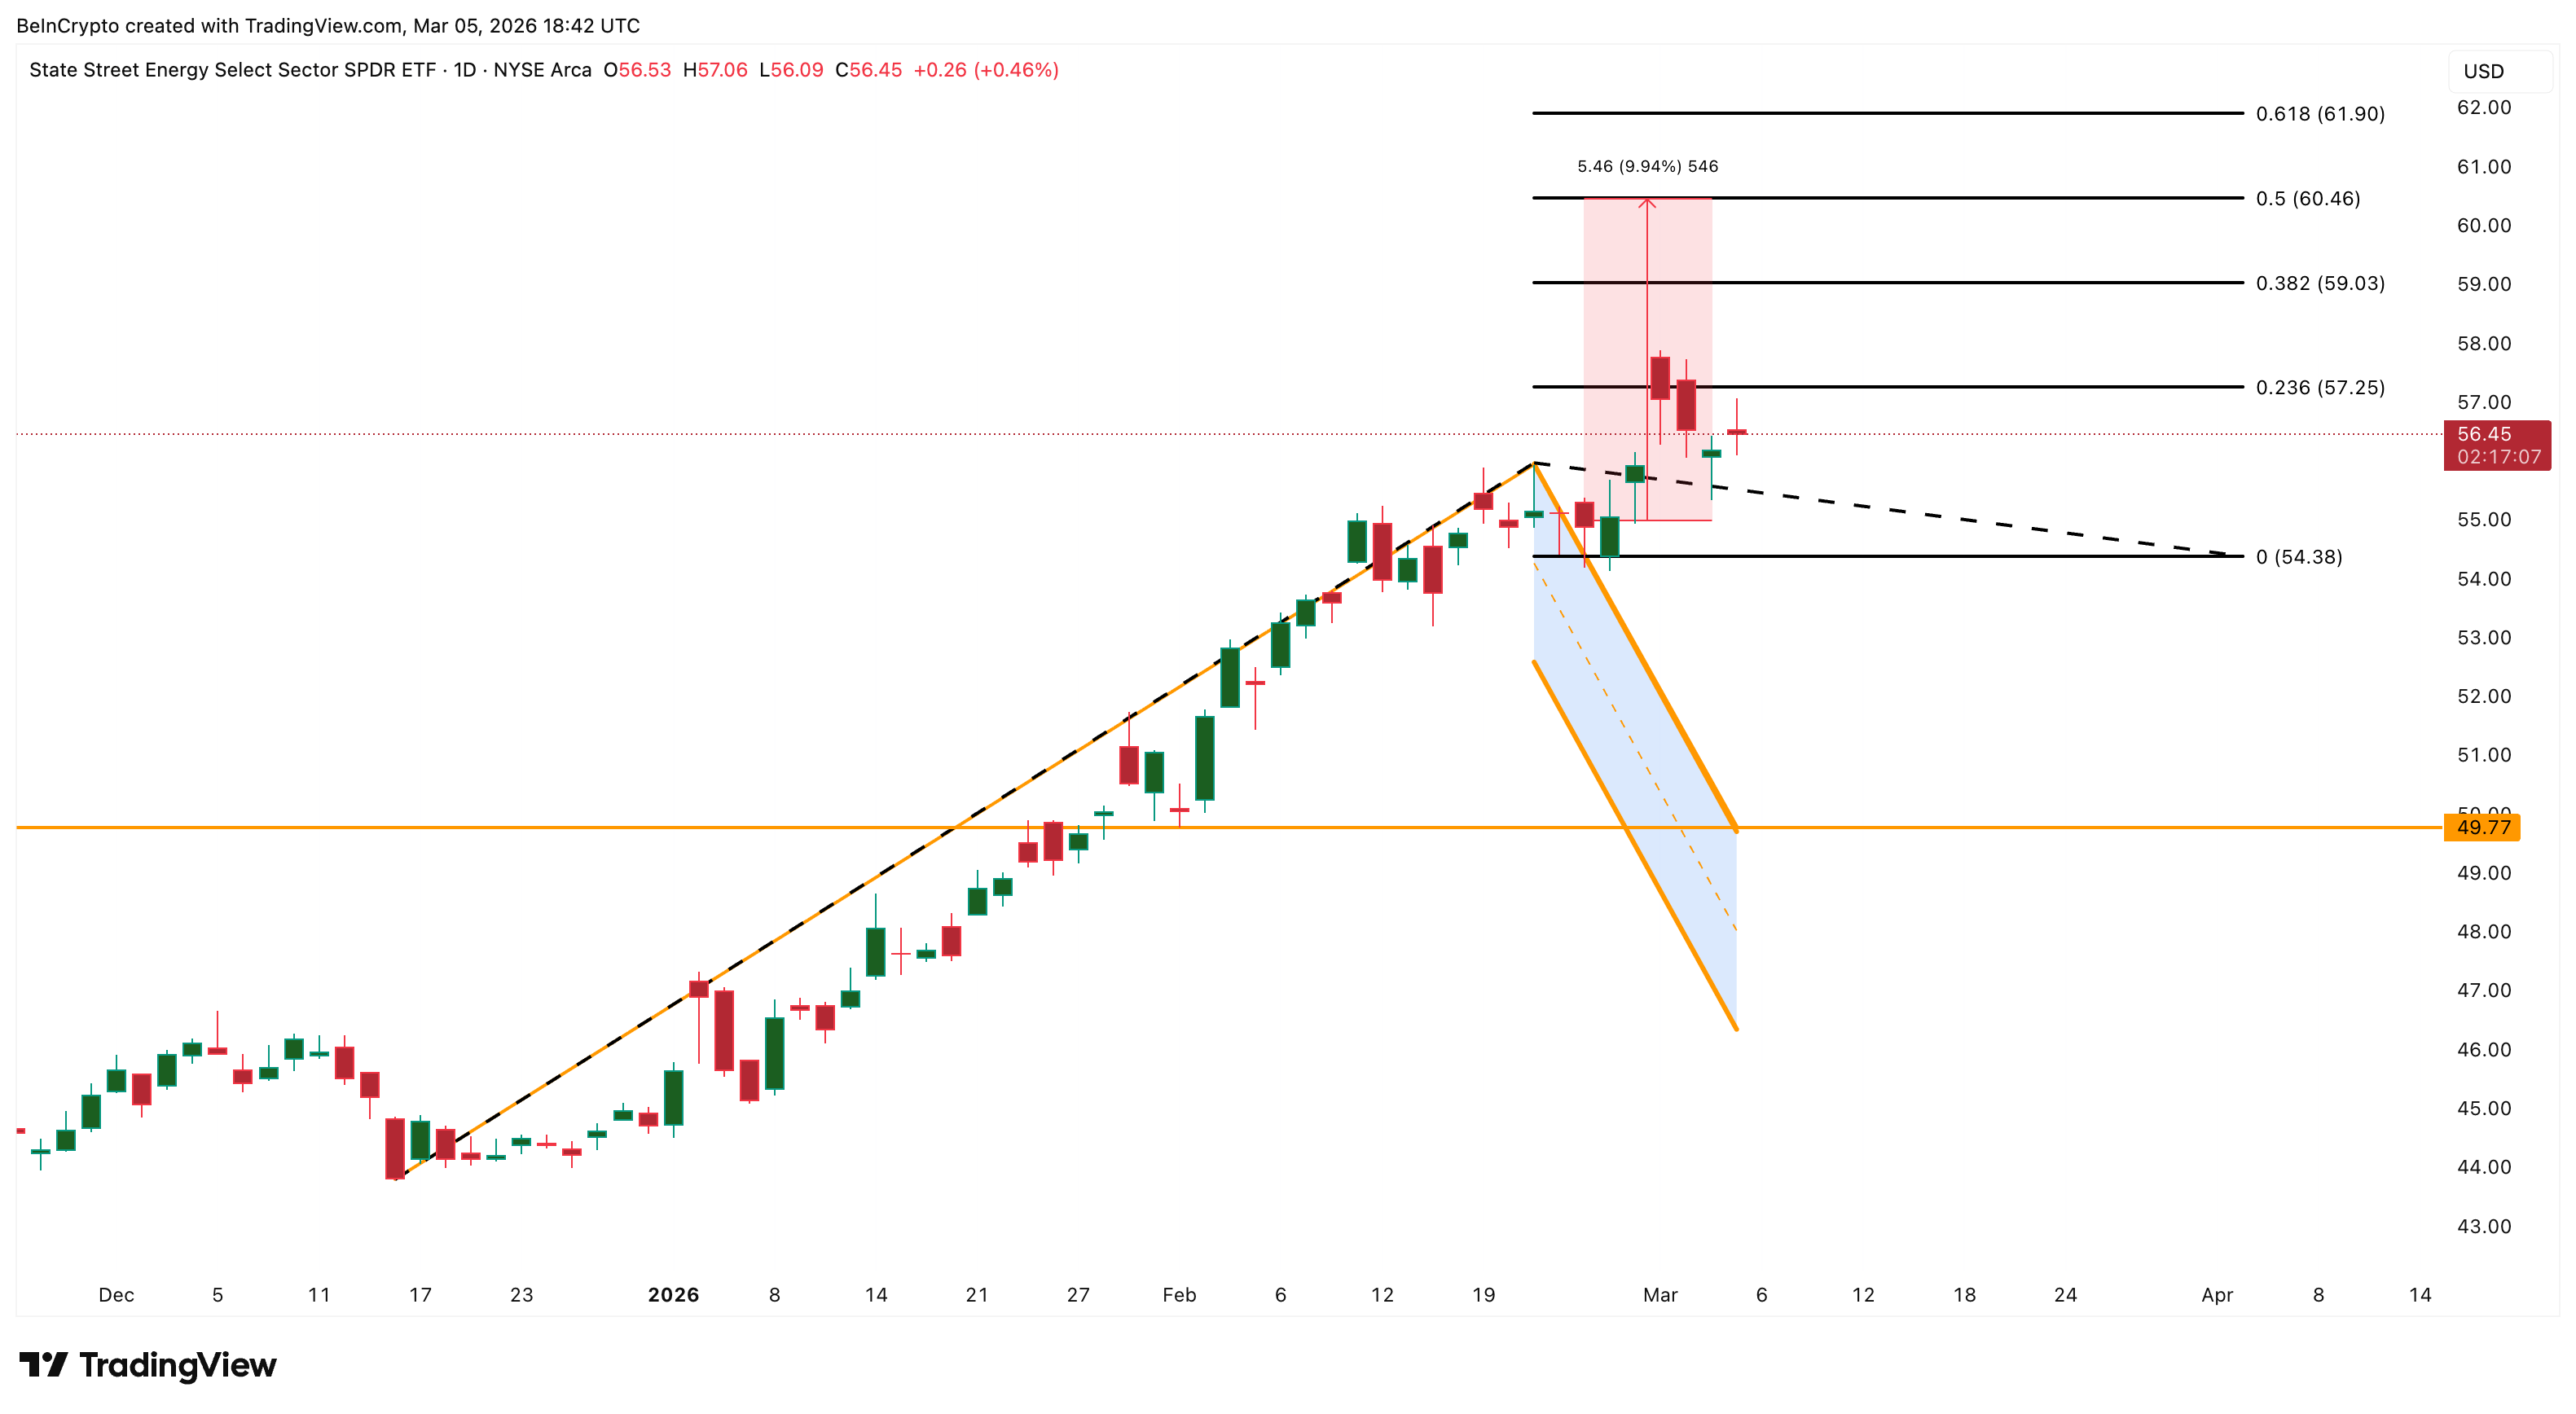 XLE Price Analysis: TradingView
Retail investors are piling in — individual investor net buying of XLE jumped 427% between Friday and Monday, with retail net turnover surging 700% since Wednesday. That kind of conviction is keeping the floor firm even as everything else sells off.
XLB tells the opposite story, despite flaunting a similar bullish flag structure.
The ETF is trading near $50, dangerously close to the technical base. The DXY rising to 99.28 is doing the damage here: a stronger dollar makes dollar-priced commodities more expensive for foreign buyers, which directly pressures materials stocks.
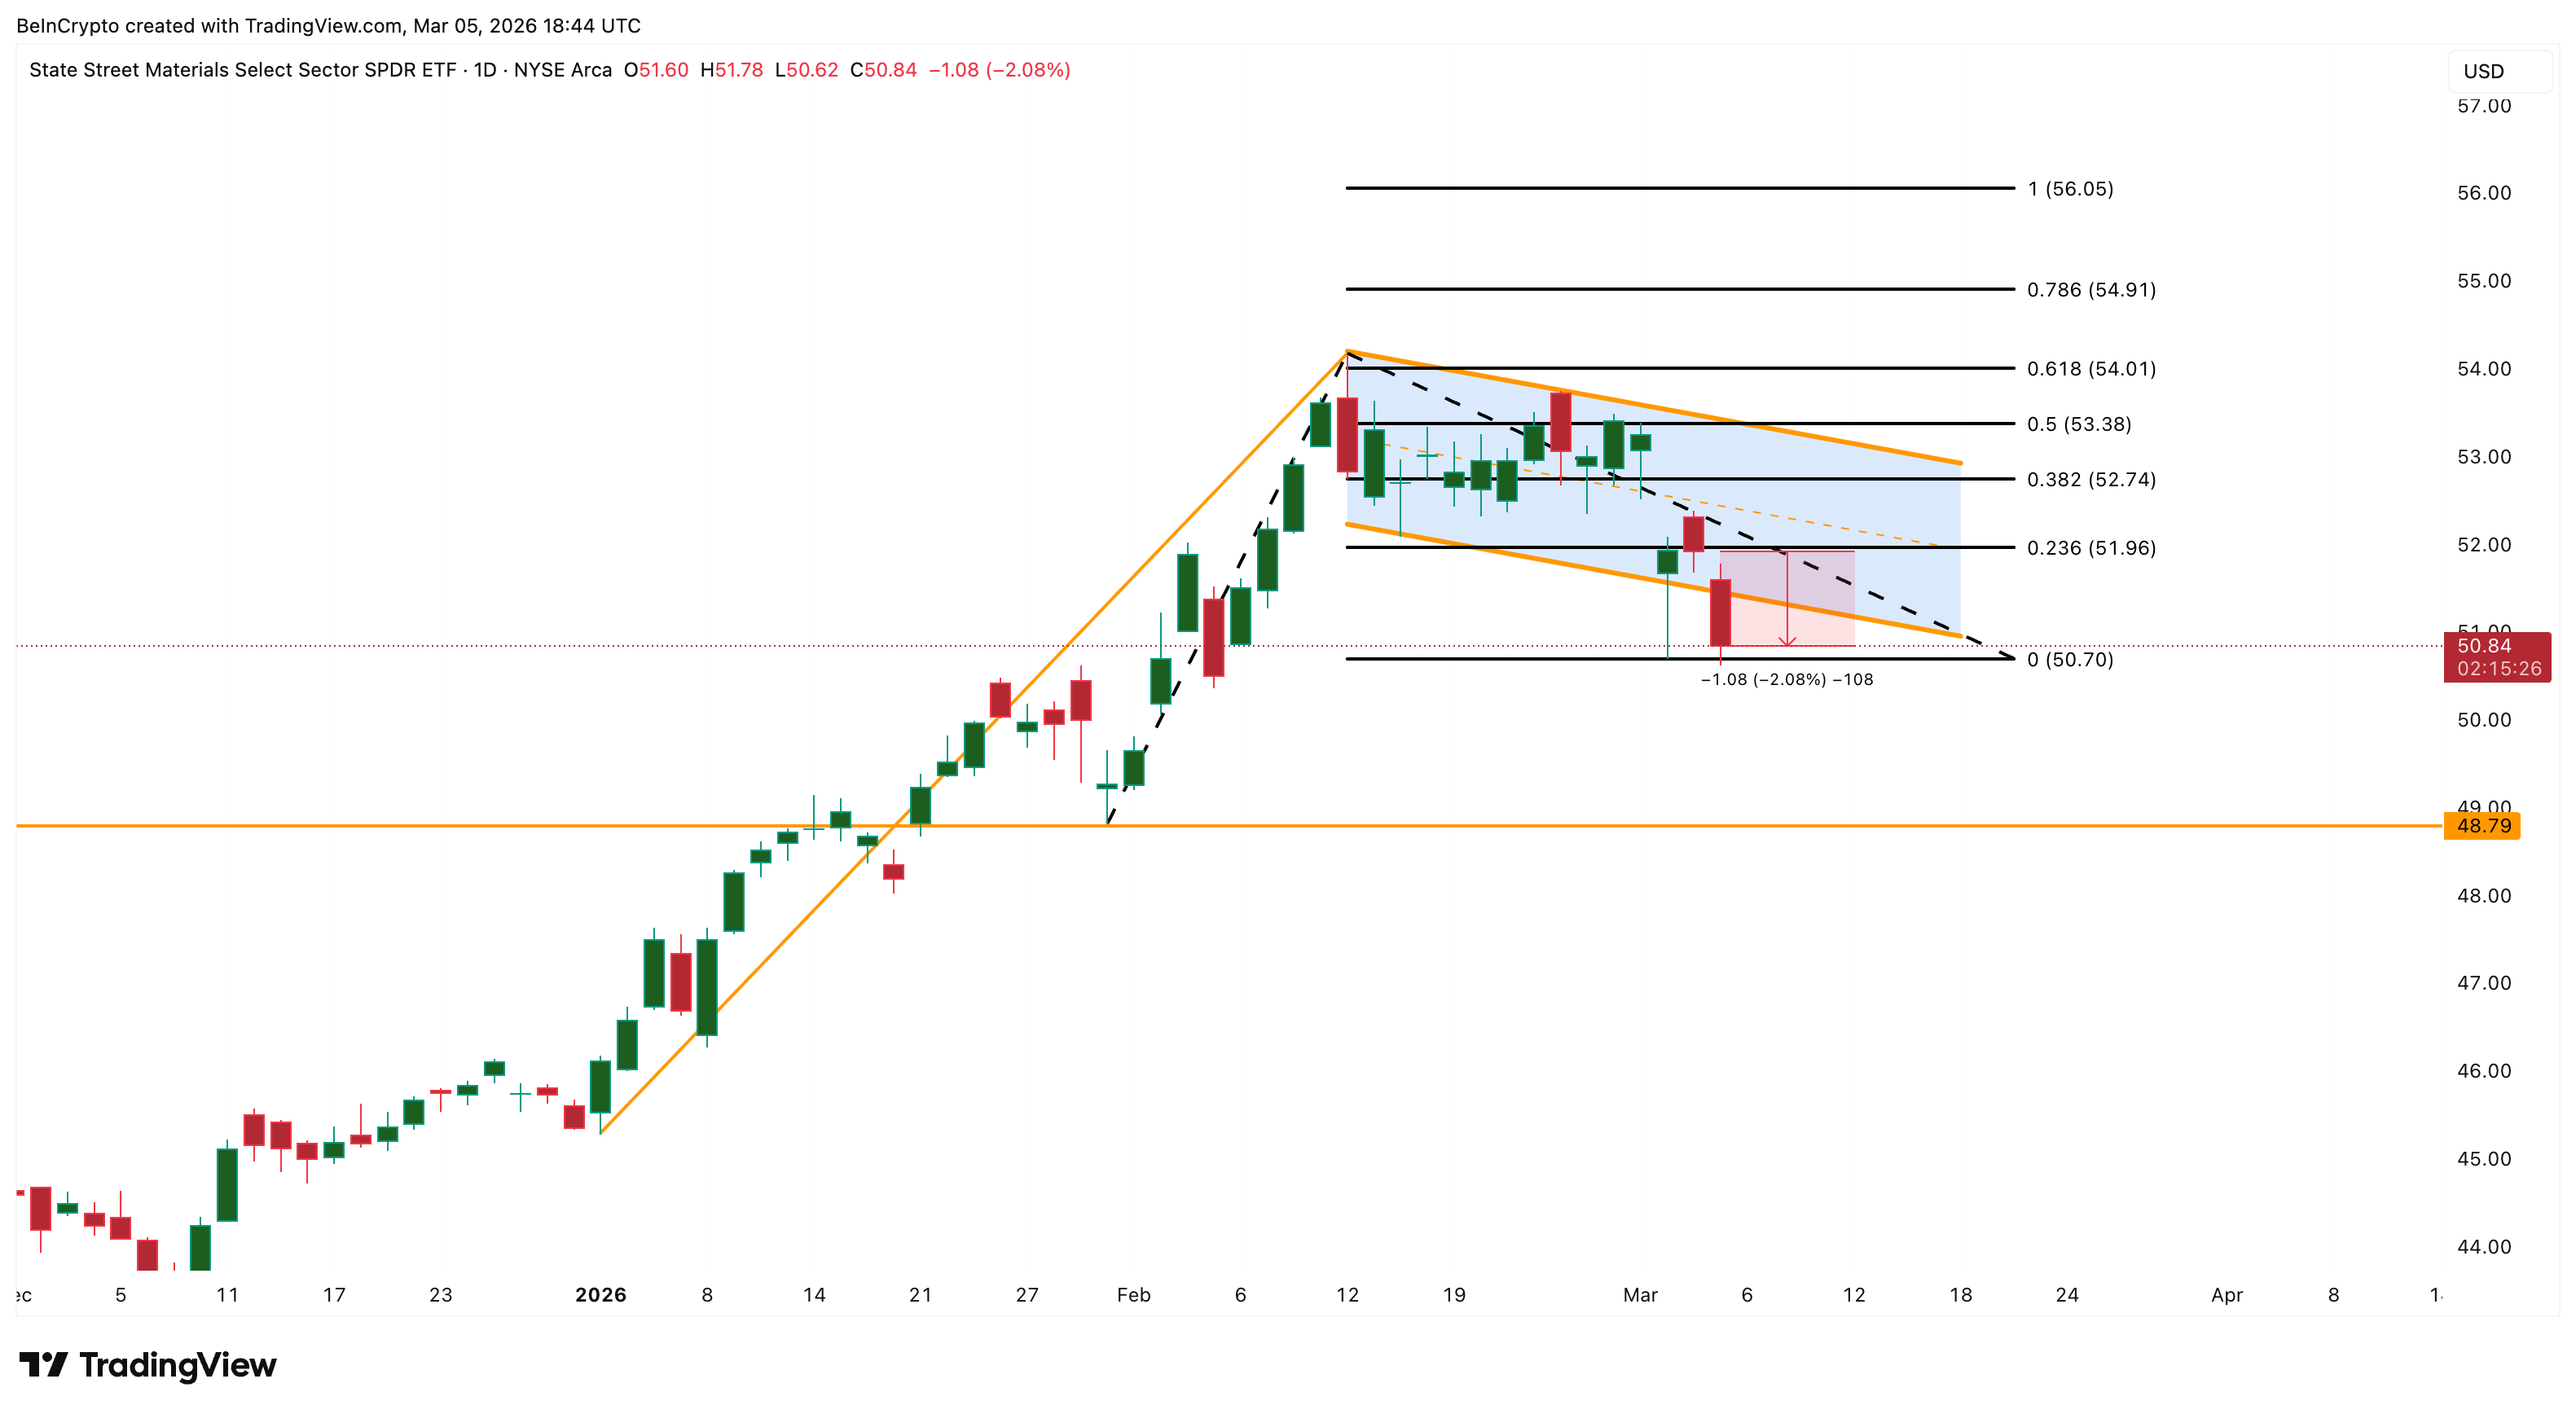 XLB Price Analysis: TradingView
Gold and silver, which support this sector, have pulled back as the dollar strengthens, but both metals remain structurally bullish and are being held back by DXY rather than breaking down on their own.
XLB needs to reclaim $51 and then $53 to stabilize. A move above $54 restores full strength. A close below $48 invalidates the broader pattern.
Morgan Stanley Drops 3.25%; Leading the Financial Sector’s Decline
Morgan Stanley (MS), the NYSE-listed investment banking giant and S&P 500 Financial sector constituent, is among the bigger names dragging the US stock market lower today.
The Financial sector is down 1.25% on the day, and Morgan Stanley is leading that weakness at over -3% to $162, at the time of writing. The stock is down 11% year-to-date and has lost 8% in the past month, underperforming the broader S&P 500 selloff covered above.
The catalyst: the bank announced it is laying off approximately 2,500 employees: 3% of its 83,000-person global workforce, across investment banking, wealth management, and investment management.
The chart is forming an inverted cup and handle pattern, a bearish continuation structure.
The rounded top completed in late January, and the current consolidation near $162 resembles the handle. The stock hit a low of $160, sitting right at the Fibonacci base.
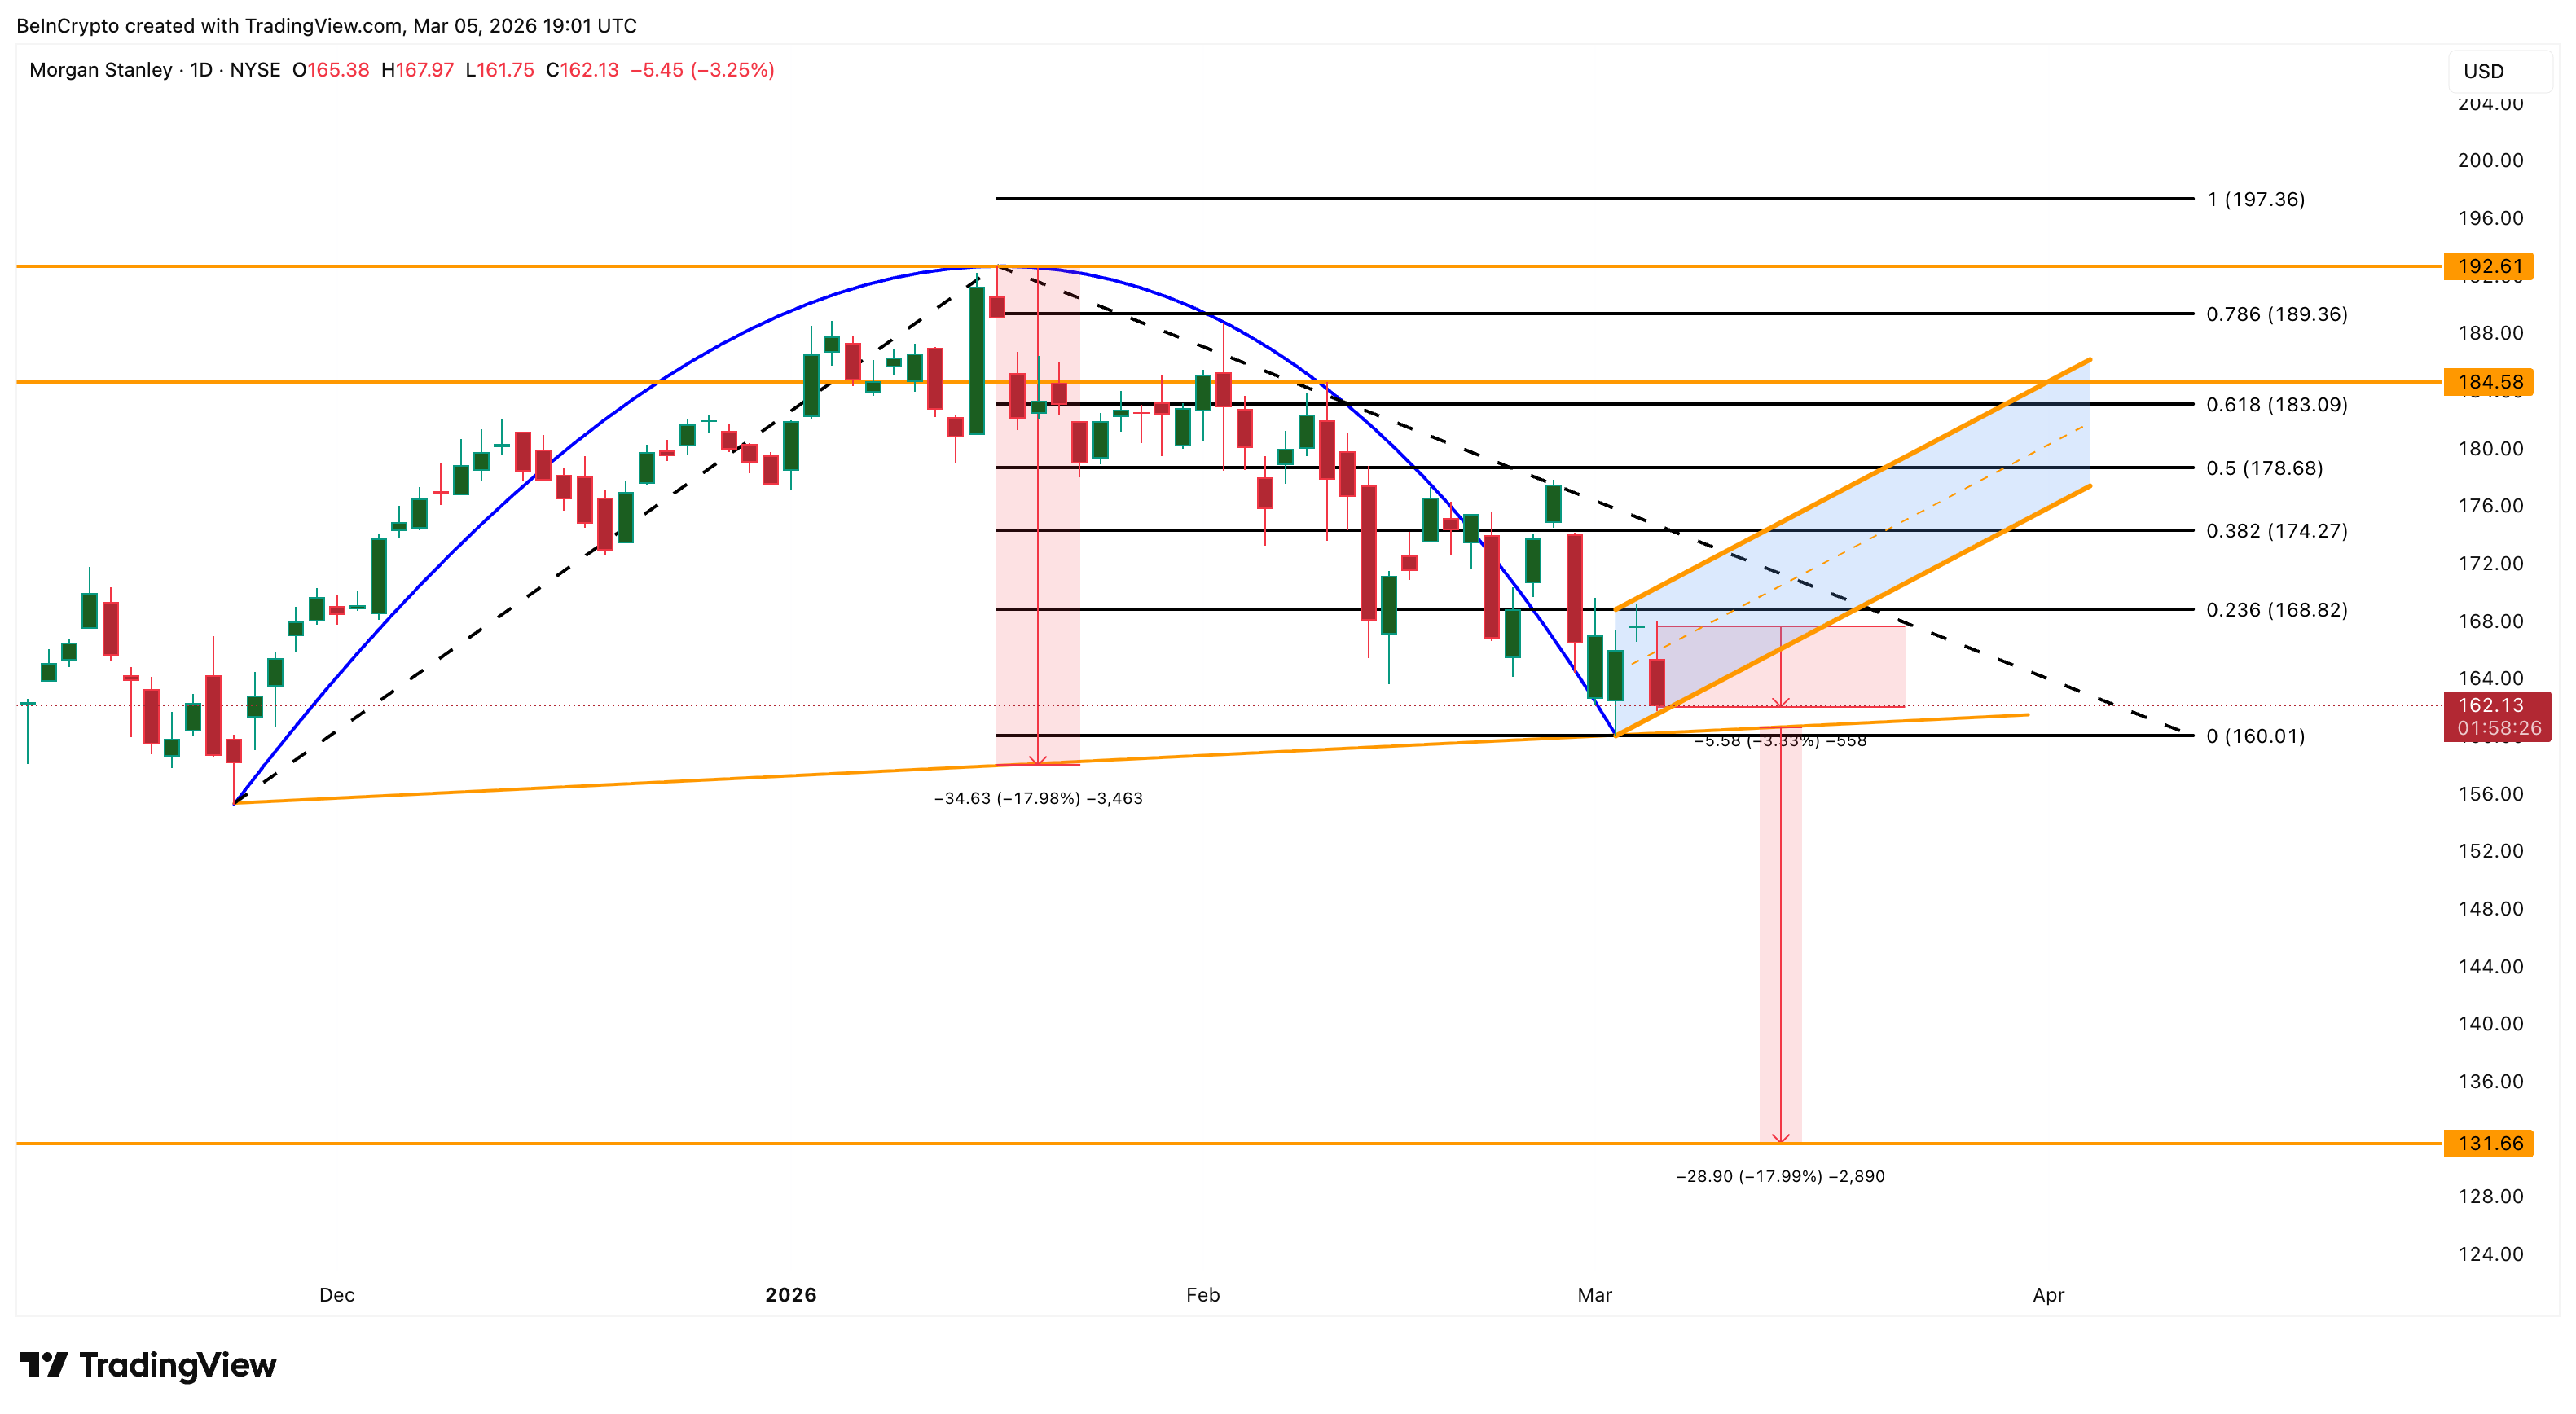 Morgan Stanley Price Analysis: TradingView
A daily close below $160 confirms the pattern and activates a measured move target of approximately $131. That’s an 18% decline from current levels. Bulls need to reclaim $184 to begin invalidating this structure. And only a move above $192 fully neutralizes the bearish setup.
0
0


 Manage all your crypto, NFT and DeFi from one place
Securely connect the portfolio you’re using to start.


0
0

0
0

0
0