
Ethereum ETH Price Could Hit $5,000, Say Tom Lee and Arthur Hayes

0
0

Ethereum is trading around $2,444, up about 2.7% over the past day. The move comes after a notable technical signal flashed on the charts earlier this month.
Traders are now asking whether ETH has enough strength to push past its nearest resistance and work toward higher price targets.
The token's 24-hour futures volume sits near $48.94 billion, while spot volume is closer to $3.43 billion. Open interest stands around $31.84 billion.
Ethereum's market cap is close to $296.16 billion, with a circulating supply of 120.68 million ETH, matching its total supply since ETH has no fixed max supply.
Traders are also watching a key level on the weekly chart. A weekly close above $2,450 is seen by some as a sign that Ethereum could reach $3,000 before revisiting lower levels again.
Why is Ethereum price going up today?
As per Ali, on August 19, Ethereum's MVRV ratio crossed above its 160-day moving average. This is often called a golden cross, and it tends to mark a shift in market momentum.
Since that crossover, ETH has climbed about 34%, moving from $1,905 to a recent high of $2,547. The rally has been sharp, and on-chain data suggests there may still be room to run.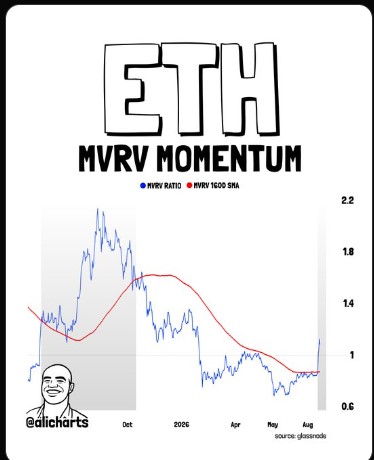
Are Ethereum whales buying or selling?
Wallet data shows accumulation from larger holders. Addresses holding more than 10,000 ETH grew by 1.74%, with 17 new whale wallets joining that group in the past week.
At the same time, ETH is leaving exchanges. More than 180,764 ETH, worth close to $440 million, was withdrawn from exchange wallets over the same period. Traders often read exchange outflows as a sign that holders plan to keep their coins rather than sell.
What is Ethereum's next resistance level?
Ethereum's next real test sits between $2,722 and $2,970. URPD data shows that roughly 16.70 million ETH were originally bought within this price band, which makes it a heavy supply zone.
A large amount of coins bought at one price level can act like a ceiling, since many holders may sell once they return to their entry price.
If Ethereum clears this zone, the next MVRV pricing band points to around $5,363, based on the 2.4 MVRV level. That said, a rejection from resistance and a pullback toward the realized price near $2,235 also remains a reasonable outcome before any bigger move.
Will Ethereum reach $5,000?
Arthur Hayes, speaking on a recent podcast, described Ethereum as one of the more disliked large-cap altcoins in the current market, even though it still trades below its 2021 all-time high.
Hayes noted that ETH remains his biggest holding at Maelstrom outside of bitcoin. He believes the coin has room to catch up since it has lagged behind other assets this cycle, and said a move above $3,000 could open a path toward the $5,000 mark.
Trader Ted Pillows pointed out that Ethereum's drop below $1,550 earlier this year may have been a false breakdown rather than the start of a deeper decline. With that level now reclaimed, some traders believe the bottom for this cycle is already behind ETH.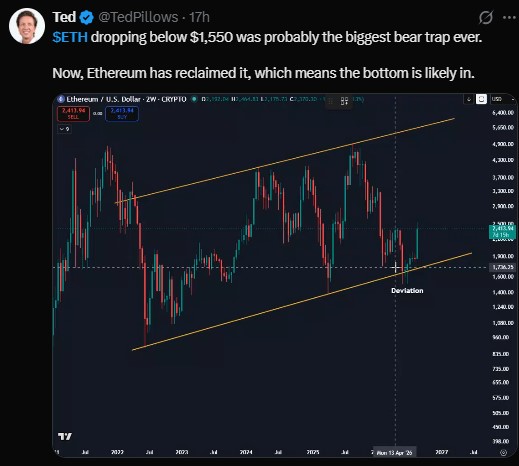
Is Tom Lee turning bullish on Ethereum again?
Fundstrat's Tom Lee has added his voice to the bullish camp, pointing to early technical signs that he believes could mark the start of a bigger move.
On August 17, Lee shared a chart showing Ethereum trading roughly 3.5% below the upper boundary of its daily Ichimoku Cloud, a zone that has kept a lid on ETH's price since October 2025.
A sustained close above that cloud would mark Ethereum's first such breakout in about ten months. Lee said on social media that seeing that happen would be a welcome development.
His more significant signal, however, was Ethereum's strength against Bitcoin. In an update from BitMine, Lee pointed to the ETH/BTC ratio trading near 0.02994 and climbing, and said he sees looser financial conditions ahead as a tailwind for the broader crypto market.
He noted that this ratio has now pushed back above the long-term downtrend line that has weighed on Ethereum for years.
Lee traced Ethereum's past periods of outperformance to specific catalysts: initial coin offerings in 2017 and 2018, the NFT boom of 2020 and 2021, and the stablecoin surge of 2025.
He believes the next wave of outperformance could be driven by Wall Street's move into tokenized assets and the rise of AI agents operating on blockchains.
In a video published in July, Lee predicted that Ethereum would climb back above $5,000 before the end of 2026, alongside a six-figure Bitcoin price.
Ethereum Derivatives Snapshot
Metric | Value |
ETH Price | $2,444.57 |
24h Change | +2.7% |
Futures Volume (24h) | $48.94B |
Spot Volume (24h) | $3.43B |
Open Interest | $31.84B (+2.67%) |
Options Volume | $1.36B |
Options Open Interest | $7.08B |
Circulating / Total Supply | 120.68M ETH |
What do the long/short ratios show?
Derivatives positioning across major exchanges looks fairly balanced, though some pockets lean bullish. The overall 24-hour long/short ratio sits at 1.0141, close to even.
On Binance, the ETH/USDT long/short ratio by accounts is higher at 2.4188, while OKX shows a ratio of 1.19. Among Binance's top traders specifically, the account-based ratio stands at 1.3546, and the position-based ratio is 1.767, both leaning toward longs.
How much has been liquidated in the ETH market?
Liquidation data shows short sellers have taken the bigger hit recently, with far more short positions wiped out than long positions across every timeframe tracked.
Timeframe | Total Liquidations | Longs | Shorts |
1 hour | $1.56M | $296.49K | $1.26M |
4 hours | $5.99M | $3.95M | $2.04M |
12 hours | $26.69M | $7.38M | $19.31M |
24 hours | $98.61M | $37.75M | $60.86M |
The heavier short liquidations over the past day suggest traders betting against Ethereum have been squeezed as the price pushed higher.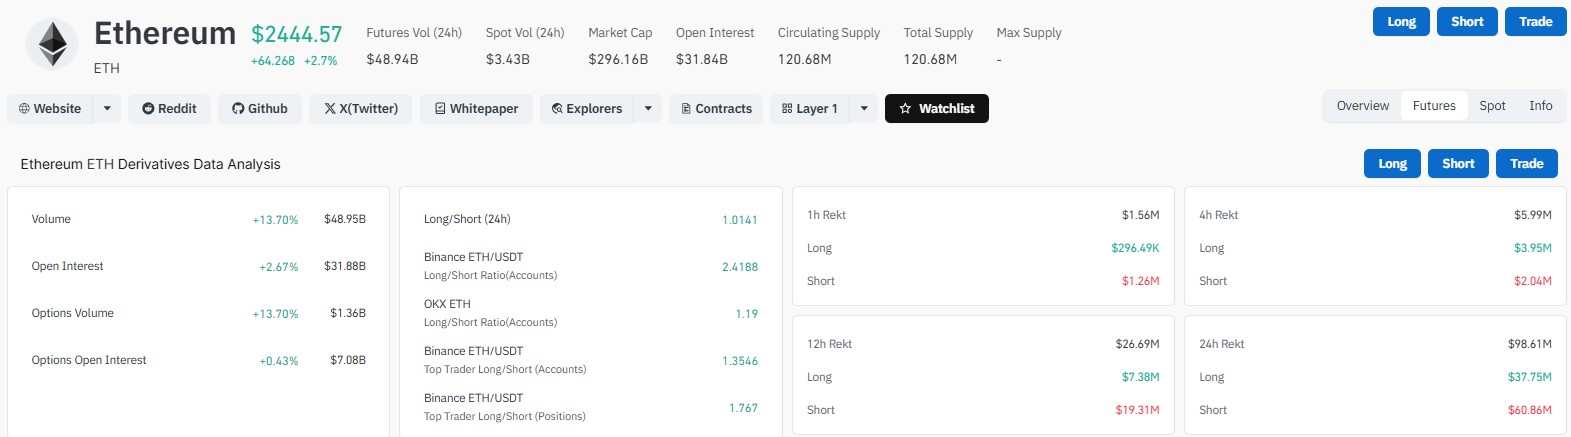
Is Ethereum outperforming Bitcoin right now?
Ethereum's price against Bitcoin has broken out of a multi-month downtrend. The pair printed a higher high, which some traders view as an early sign of a shift from a bearish structure to a bullish one.
The breakout level sits near 0.03205, with a retest zone between 0.0270 and 0.0260. If ETH/BTC holds that zone and forms a higher low, traders are watching for a possible move toward 0.040, then 0.0500, and eventually the 0.060 to 0.070 range.
Losing that breakout structure, however, would likely invalidate the bullish case and raise the risk of a failed breakout.
Tom Lee's recent commentary echoes this setup, since he has also flagged the ETH/BTC ratio's break above its multi-year downtrend as one of the more encouraging signals for Ethereum right now.
Is Ethereum a good buy right now?
Ethereum's setup looks constructive for now, but nothing is guaranteed. The $2,722 to $2,970 zone remains the key hurdle standing between ETH and a run toward higher levels.
A clean break above that range, paired with continued whale accumulation and exchange outflows, would strengthen the bullish case.
A rejection, on the other hand, could send ETH back toward the $2,235 realized price zone before another attempt higher. Prominent voices like Tom Lee and Arthur Hayes have both pointed to $5,000 as a plausible target if momentum continues to build.
Disclaimer
This article is for informational purposes only and does not constitute financial, investment, or trading advice. Cryptocurrency markets are highly volatile, and prices can move sharply in either direction. Always do your own research and consult a licensed financial advisor before making investment decisions.
0
0

 Manage all your crypto, NFT and DeFi from one place
Securely connect the portfolio you’re using to start.


