Bittensor (TAO) Price Crosses $300 To Mark 2-Month High As Bulls Reign Supreme

0
0

Bittensor (TAO) crossed $300 on March 20 for the first time since January, surging more than 17% in 24 hours after Nvidia CEO Jensen Huang referenced the protocol’s Covenant-72B model on the All-In Podcast. TAO is trading at approximately $292–$297 as the session consolidates just below the $299 Fibonacci extension.
The move is not purely sentiment-driven. Two months of improving buying pressure are now resolving at the price level where the heaviest concentration of leveraged short positions sits. The result is a technically and fundamentally reinforced breakout attempt.
TAO Holders Are Pouring Money
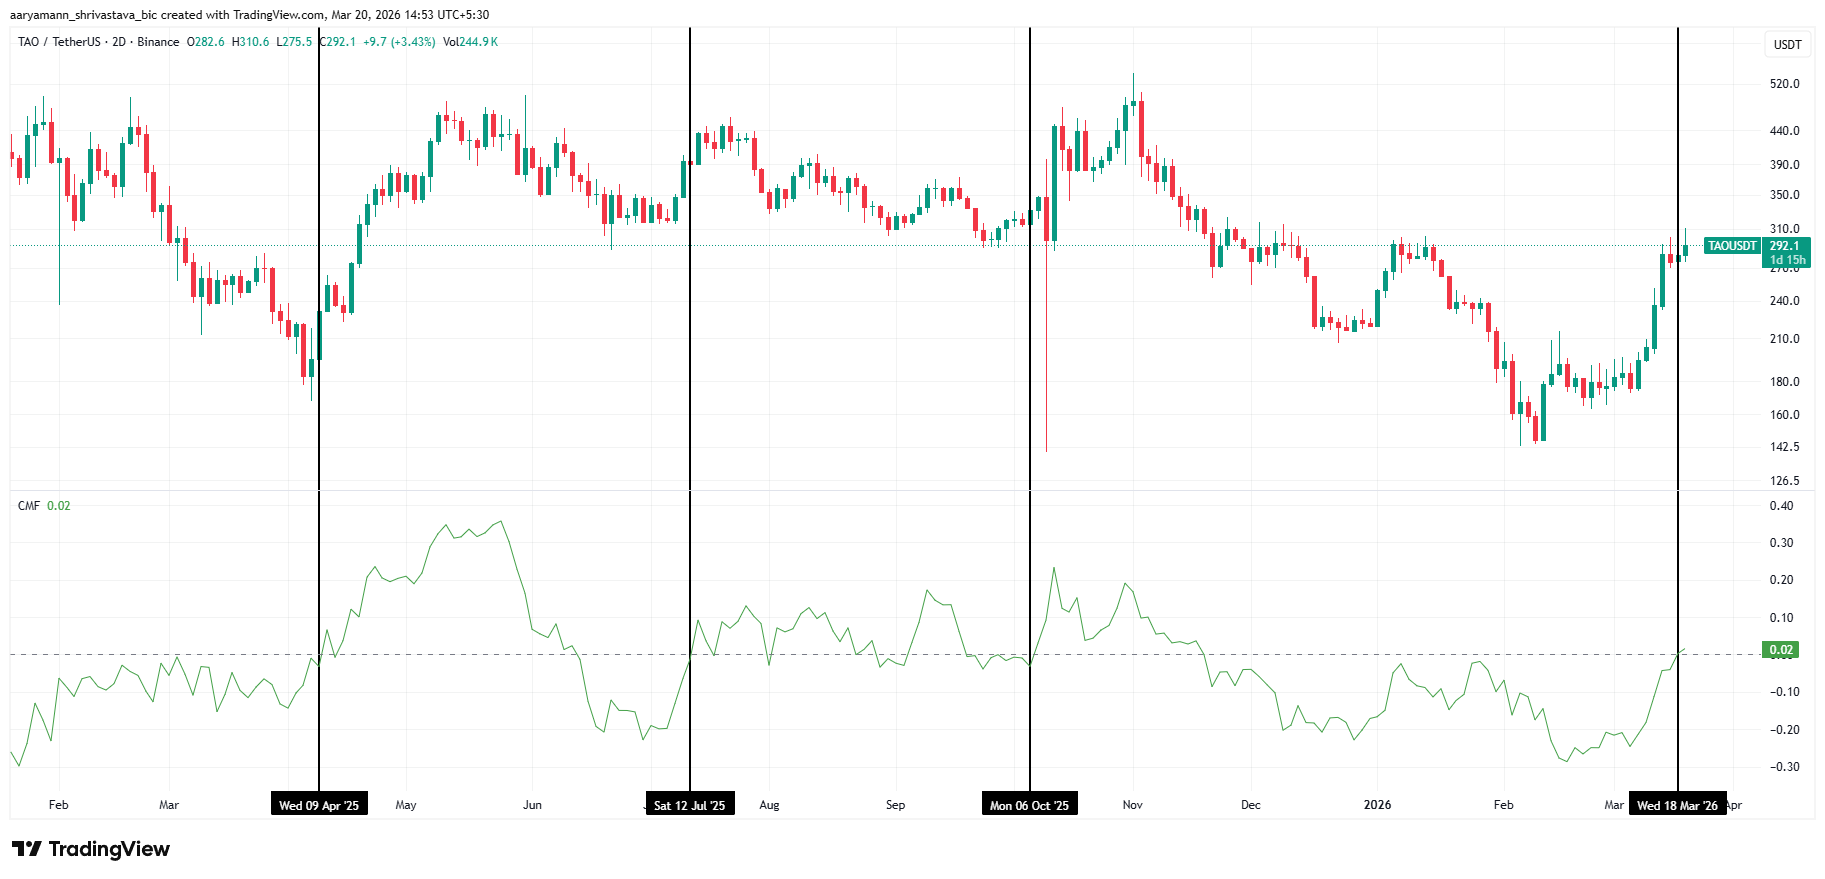
The Chaikin Money Flow (CMF) on TAO just crossed above 0.0, printing a current reading of +0.02 as of March 20. This is the first positive CMF reading since the October 2025 rally, when TAO briefly reached the $480 range. This was before a prolonged selloff drove it to lows near $142 in early February 2026.
During that decline, CMF fell as deep as approximately -0.30, reflecting sustained capital outflows across December 2025 and January 2026. The recovery from those lows has been gradual, with CMF slowly grinding back toward zero through February and early March.
Want more token insights like this? Sign up for Editor Harsh Notariya’s Daily Crypto Newsletter here.
 TAO CMF. Source: TradingView
A CMF crossing above zero indicates that net buying volume is now outpacing selling volume on a per-candle basis. Historically, on this chart, the three prior crossings of CMF above zero — in April 2025, July 2025, and October 2025 — each preceded a meaningful price advance, followed by a subsequent correction. The current crossing, therefore, carries structural significance beyond the single-session move triggered by the Nvidia catalyst.
For the signal to hold, CMF will need to sustain positive readings on the next 2-day closes. A reversal back below zero would suggest the breakout was a liquidity event rather than a trend shift.
TAO Traders Are Bullish
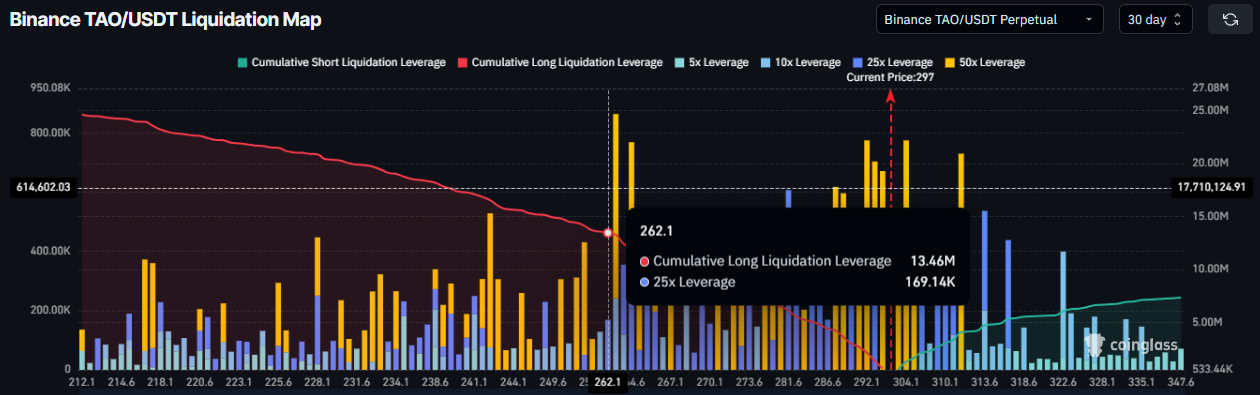
The Coinglass liquidation map for TAO/USDT perpetuals over the past 30 days shows the most concentrated short liquidation cluster in the chart, sitting directly above the current price. Between $300 and $313, multiple overlapping bars of 50x leveraged short positions reach cumulative totals approaching the chart’s $17.71 million threshold marked by the dashed horizontal line.
This positioning creates a mechanical feedback loop. As TAO moves through $300, those short positions are force-liquidated. Furthermore, the buying required to close them adds further upward pressure. The effect is compounded by the density of the cluster — the liquidation bars in the $304–$313 range are among the tallest in the 30-day window. This suggests a significant number of traders shorted TAO’s recent recovery.
 XRP Liquidation Map. Source: Coinglass
Meanwhile, the cumulative long liquidation leverage at $262 sits at $13.46 million, a level already well below the current price. Those long liquidations have largely been absorbed, removing the downside trigger pressure that existed earlier in March. The asymmetry is now skewed upward: far more leveraged capital sits above the current price waiting to be liquidated.
TAO Price Is In For a Rise
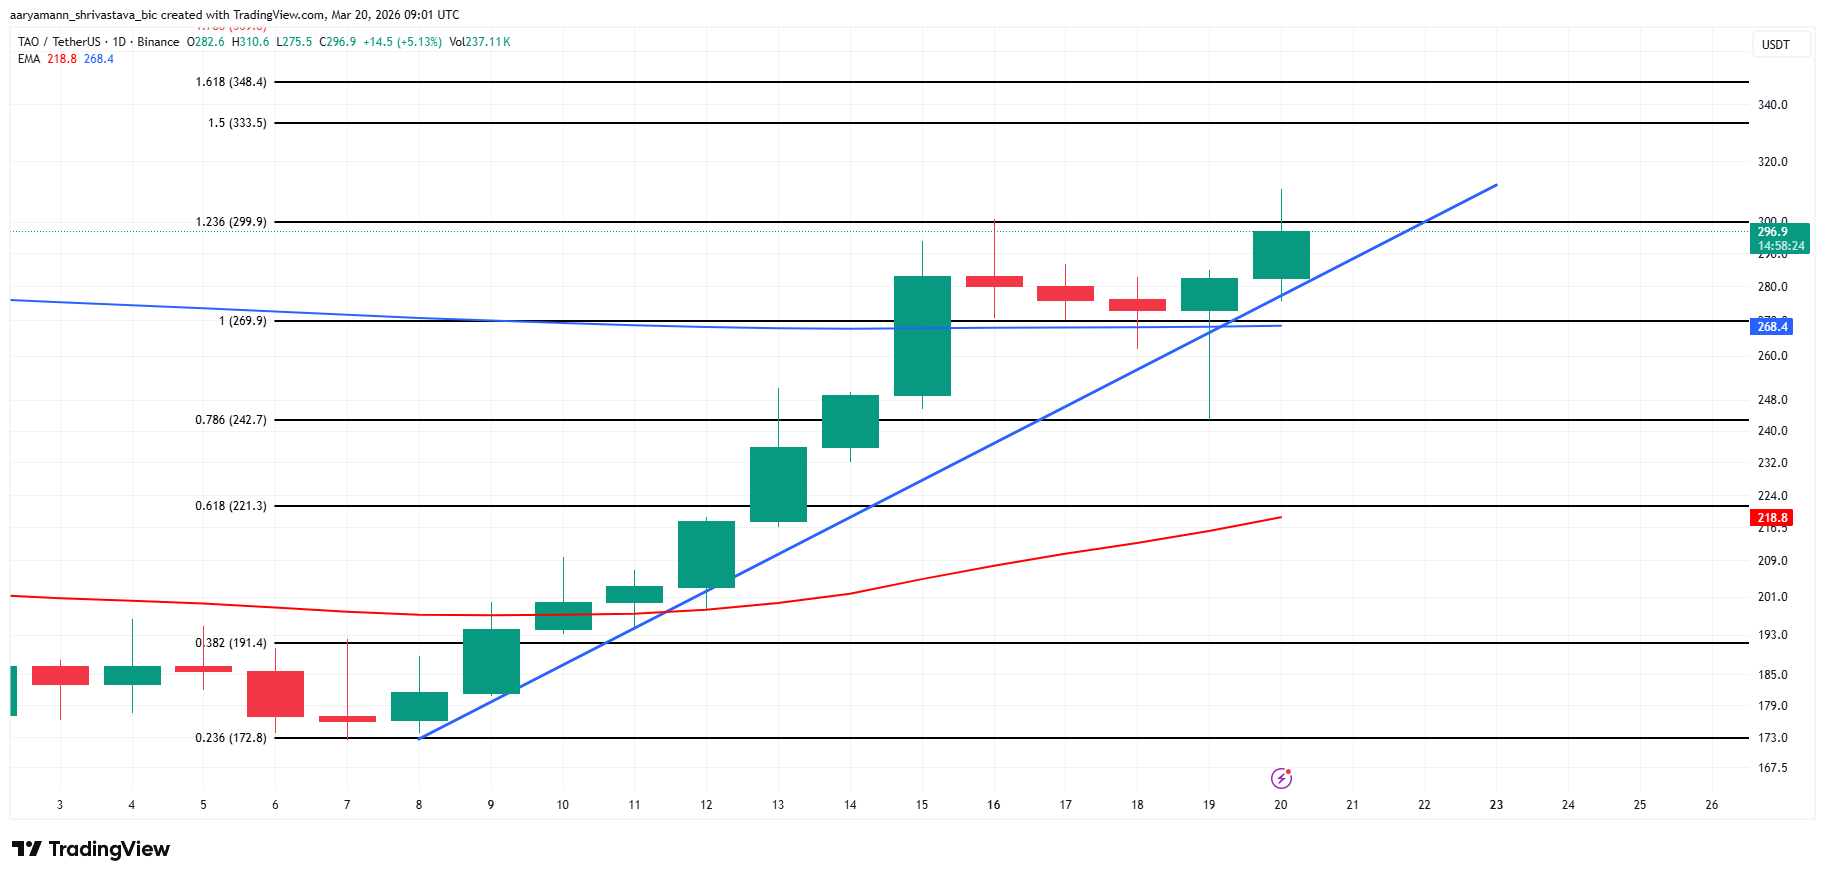
At the moment, TAO’s price has recovered from a low of approximately $172 in early March. This rise came after TAO rallied through every Fibonacci extension level in sequence. The 0.618 level at $221 was cleared around March 12. The 1.0 extension at $269 was cleared on March 14, and the price found support above the 200-day EMA at $268 before the Nvidia-driven push began.
TAO is now testing the 1.236 Fibonacci extension at $299. The steep ascending trendline from the March lows continues to guide price higher, with the 50-day EMA at $218 and 200-day EMA at $268 both now acting as support below.
A confirmed daily close above $299 opens the 1.5 extension at $333 as the next measured target. This represents approximately 12% additional upside. The 1.618 extension at $348 follows, aligning with the $360–$370 zone identified as major resistance.
 TAO Price Analysis. Source: TradingView
On the other hand, invalidation hinges on the 1.0 Fibonacci level at $269 and the 200-day EMA at $268. A close below that zone would indicate that the Nvidia catalyst failed to produce a lasting structural change. TAO would then likely consolidate between $242 and $270 before the next directional move.
The Grayscale Bittensor ETF application pending with the SEC represents a longer-term institutional catalyst that has not yet been priced in. However, if regulatory approval progresses, it would substantially widen the buyer pool for TAO beyond retail and AI-narrative traders.
0
0


 Manage all your crypto, NFT and DeFi from one place
Securely connect the portfolio you’re using to start.

0
0

0
0

0
0

0
0