Bearish Pi Coin Pattern Rings a 45% Alarm as Dip Buyers Flee

0
0

Pi Coin (PI) price is forming a head and shoulders pattern on the 12-hour chart, threatening a 45% breakdown, while dip buyers show signs of retreating.
Momentum indicators, sentiment data, and money flow all lean bearish. The convergence of these signals raises the stakes around one key support level.
Head and Shoulders Meets an EMA Breakdown
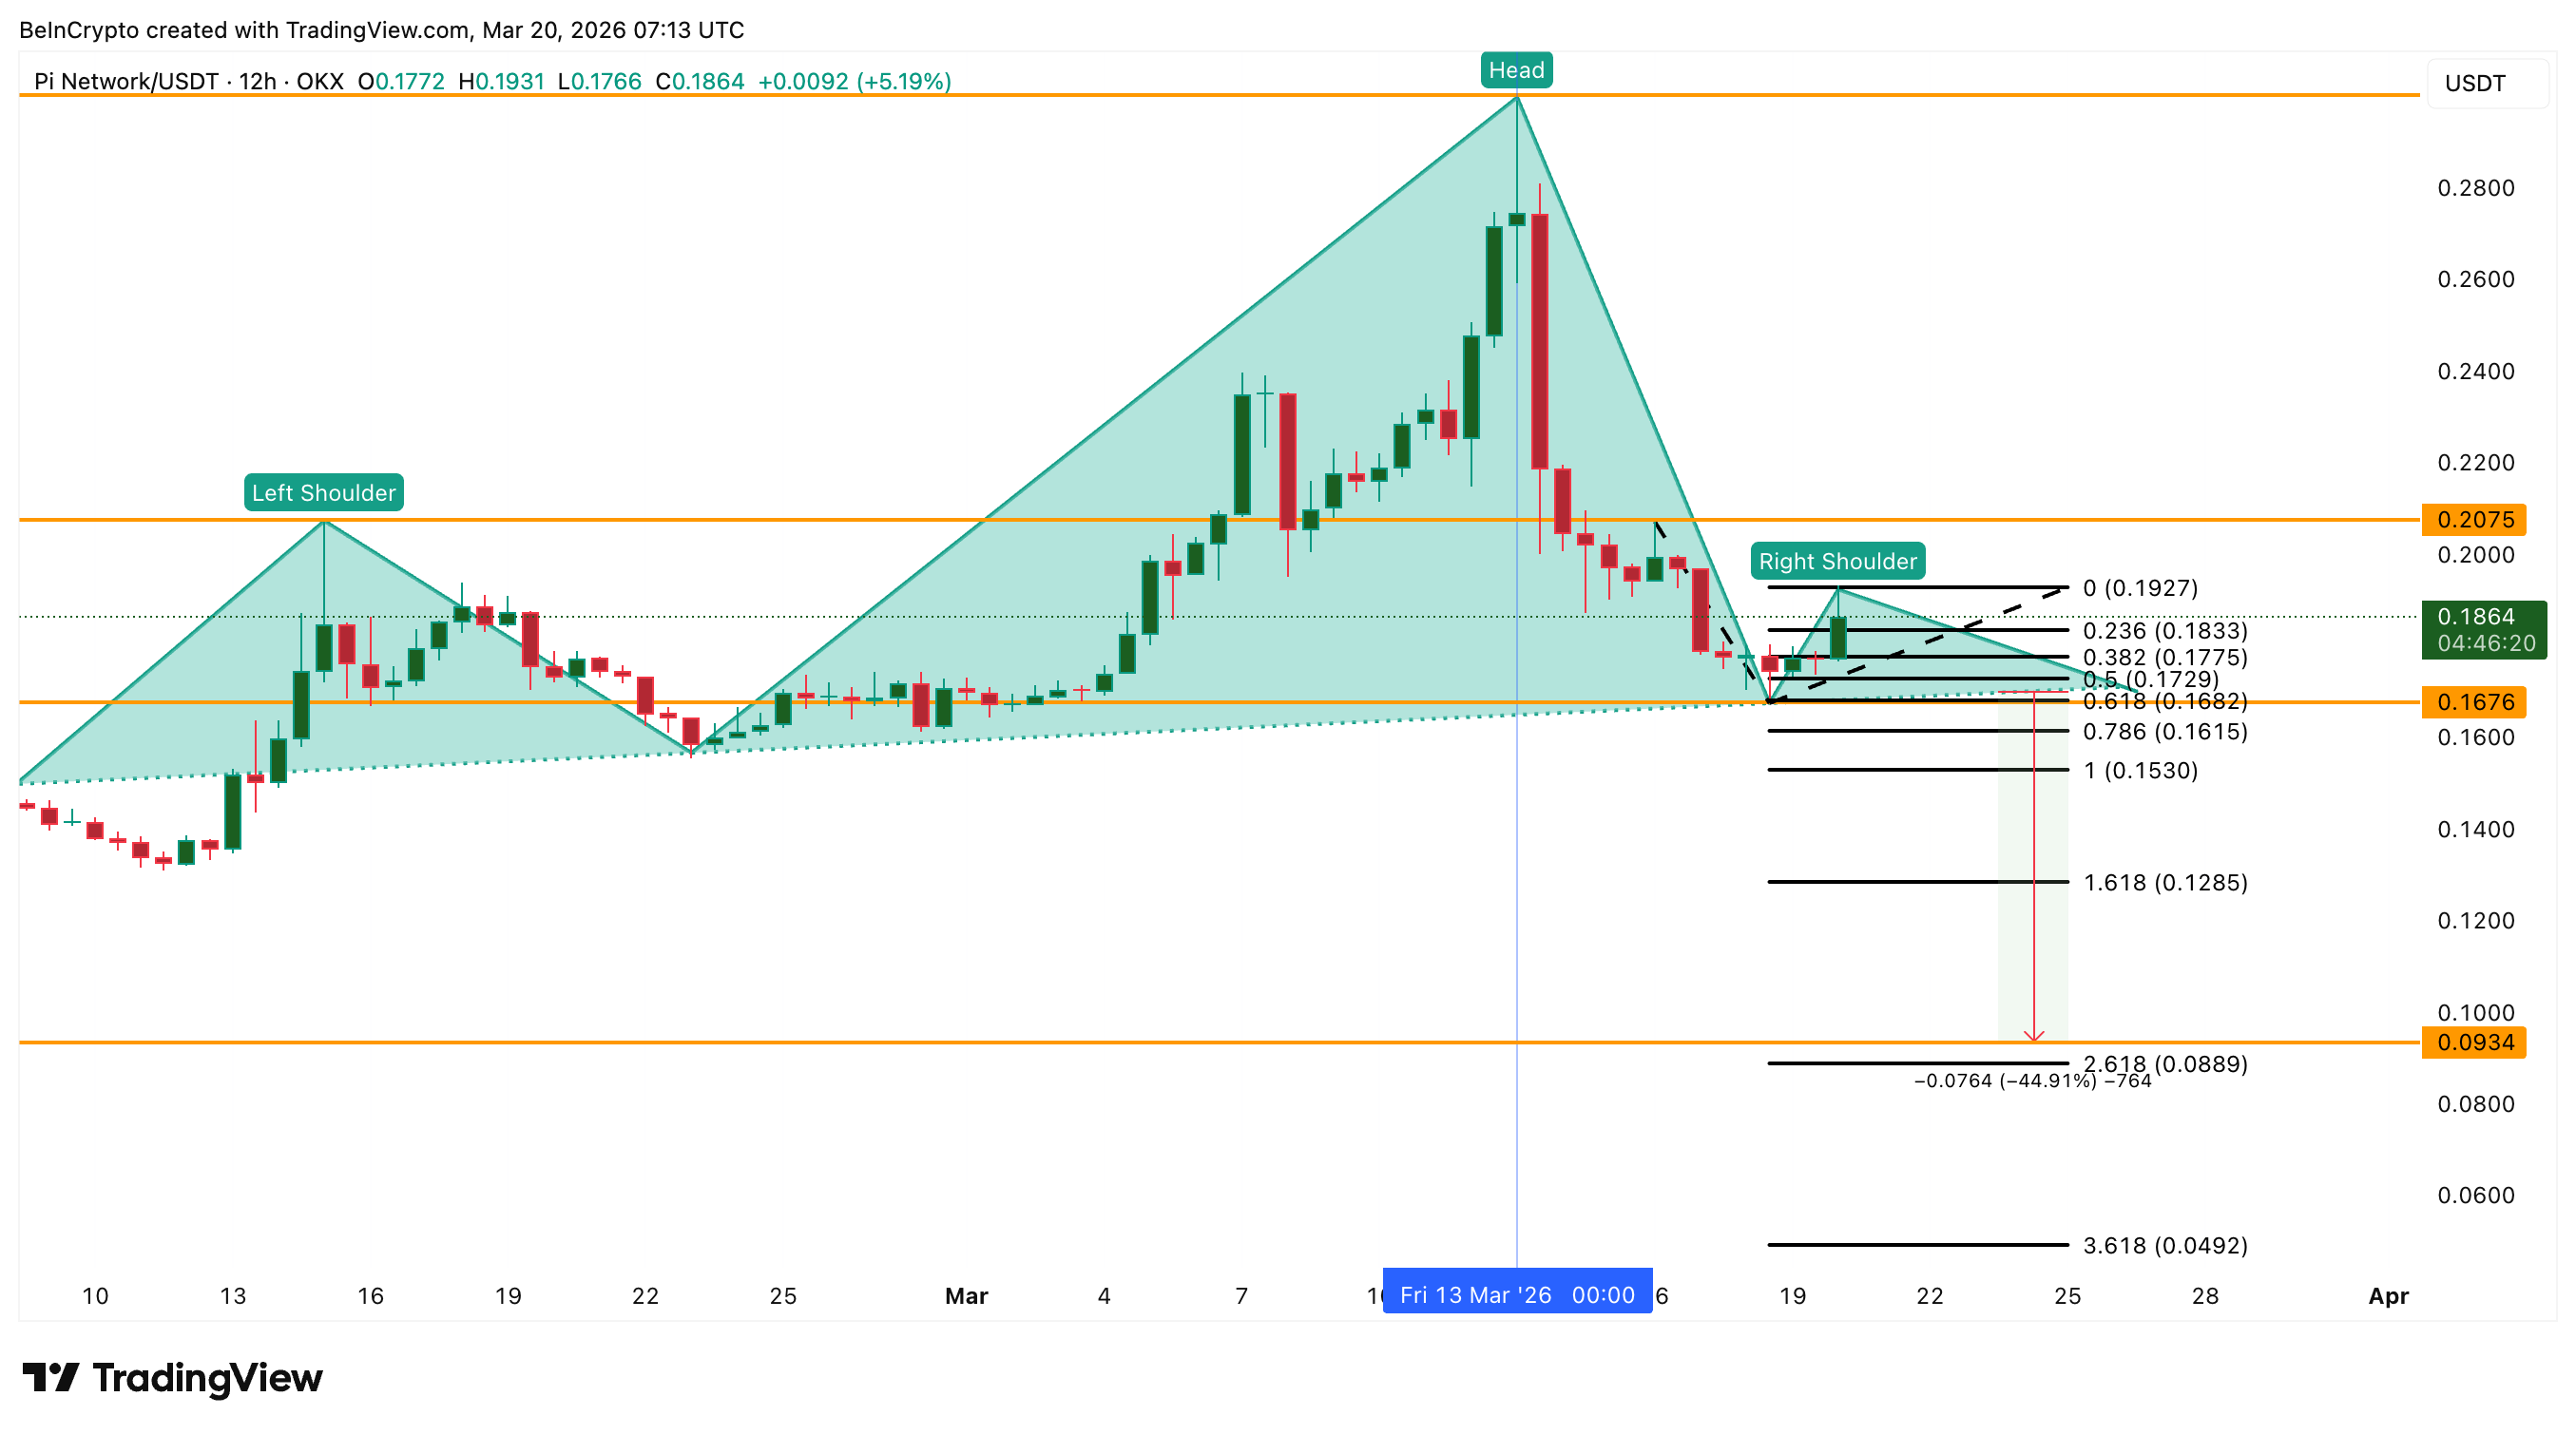
The 12-hour chart for PI shows a textbook head-and-shoulders formation. The left shoulder formed in mid-February near $0.220. The head peaked at $0.300 on March 13. The right shoulder is currently developing around $0.192. Any move up remains within the confines of the pattern unless $0.300 is breached.
The neckline break projects a measured decline of roughly 45%.
Want more token insights like this? Sign up for Editor Harsh Notariya’s Daily Crypto Newsletter here.
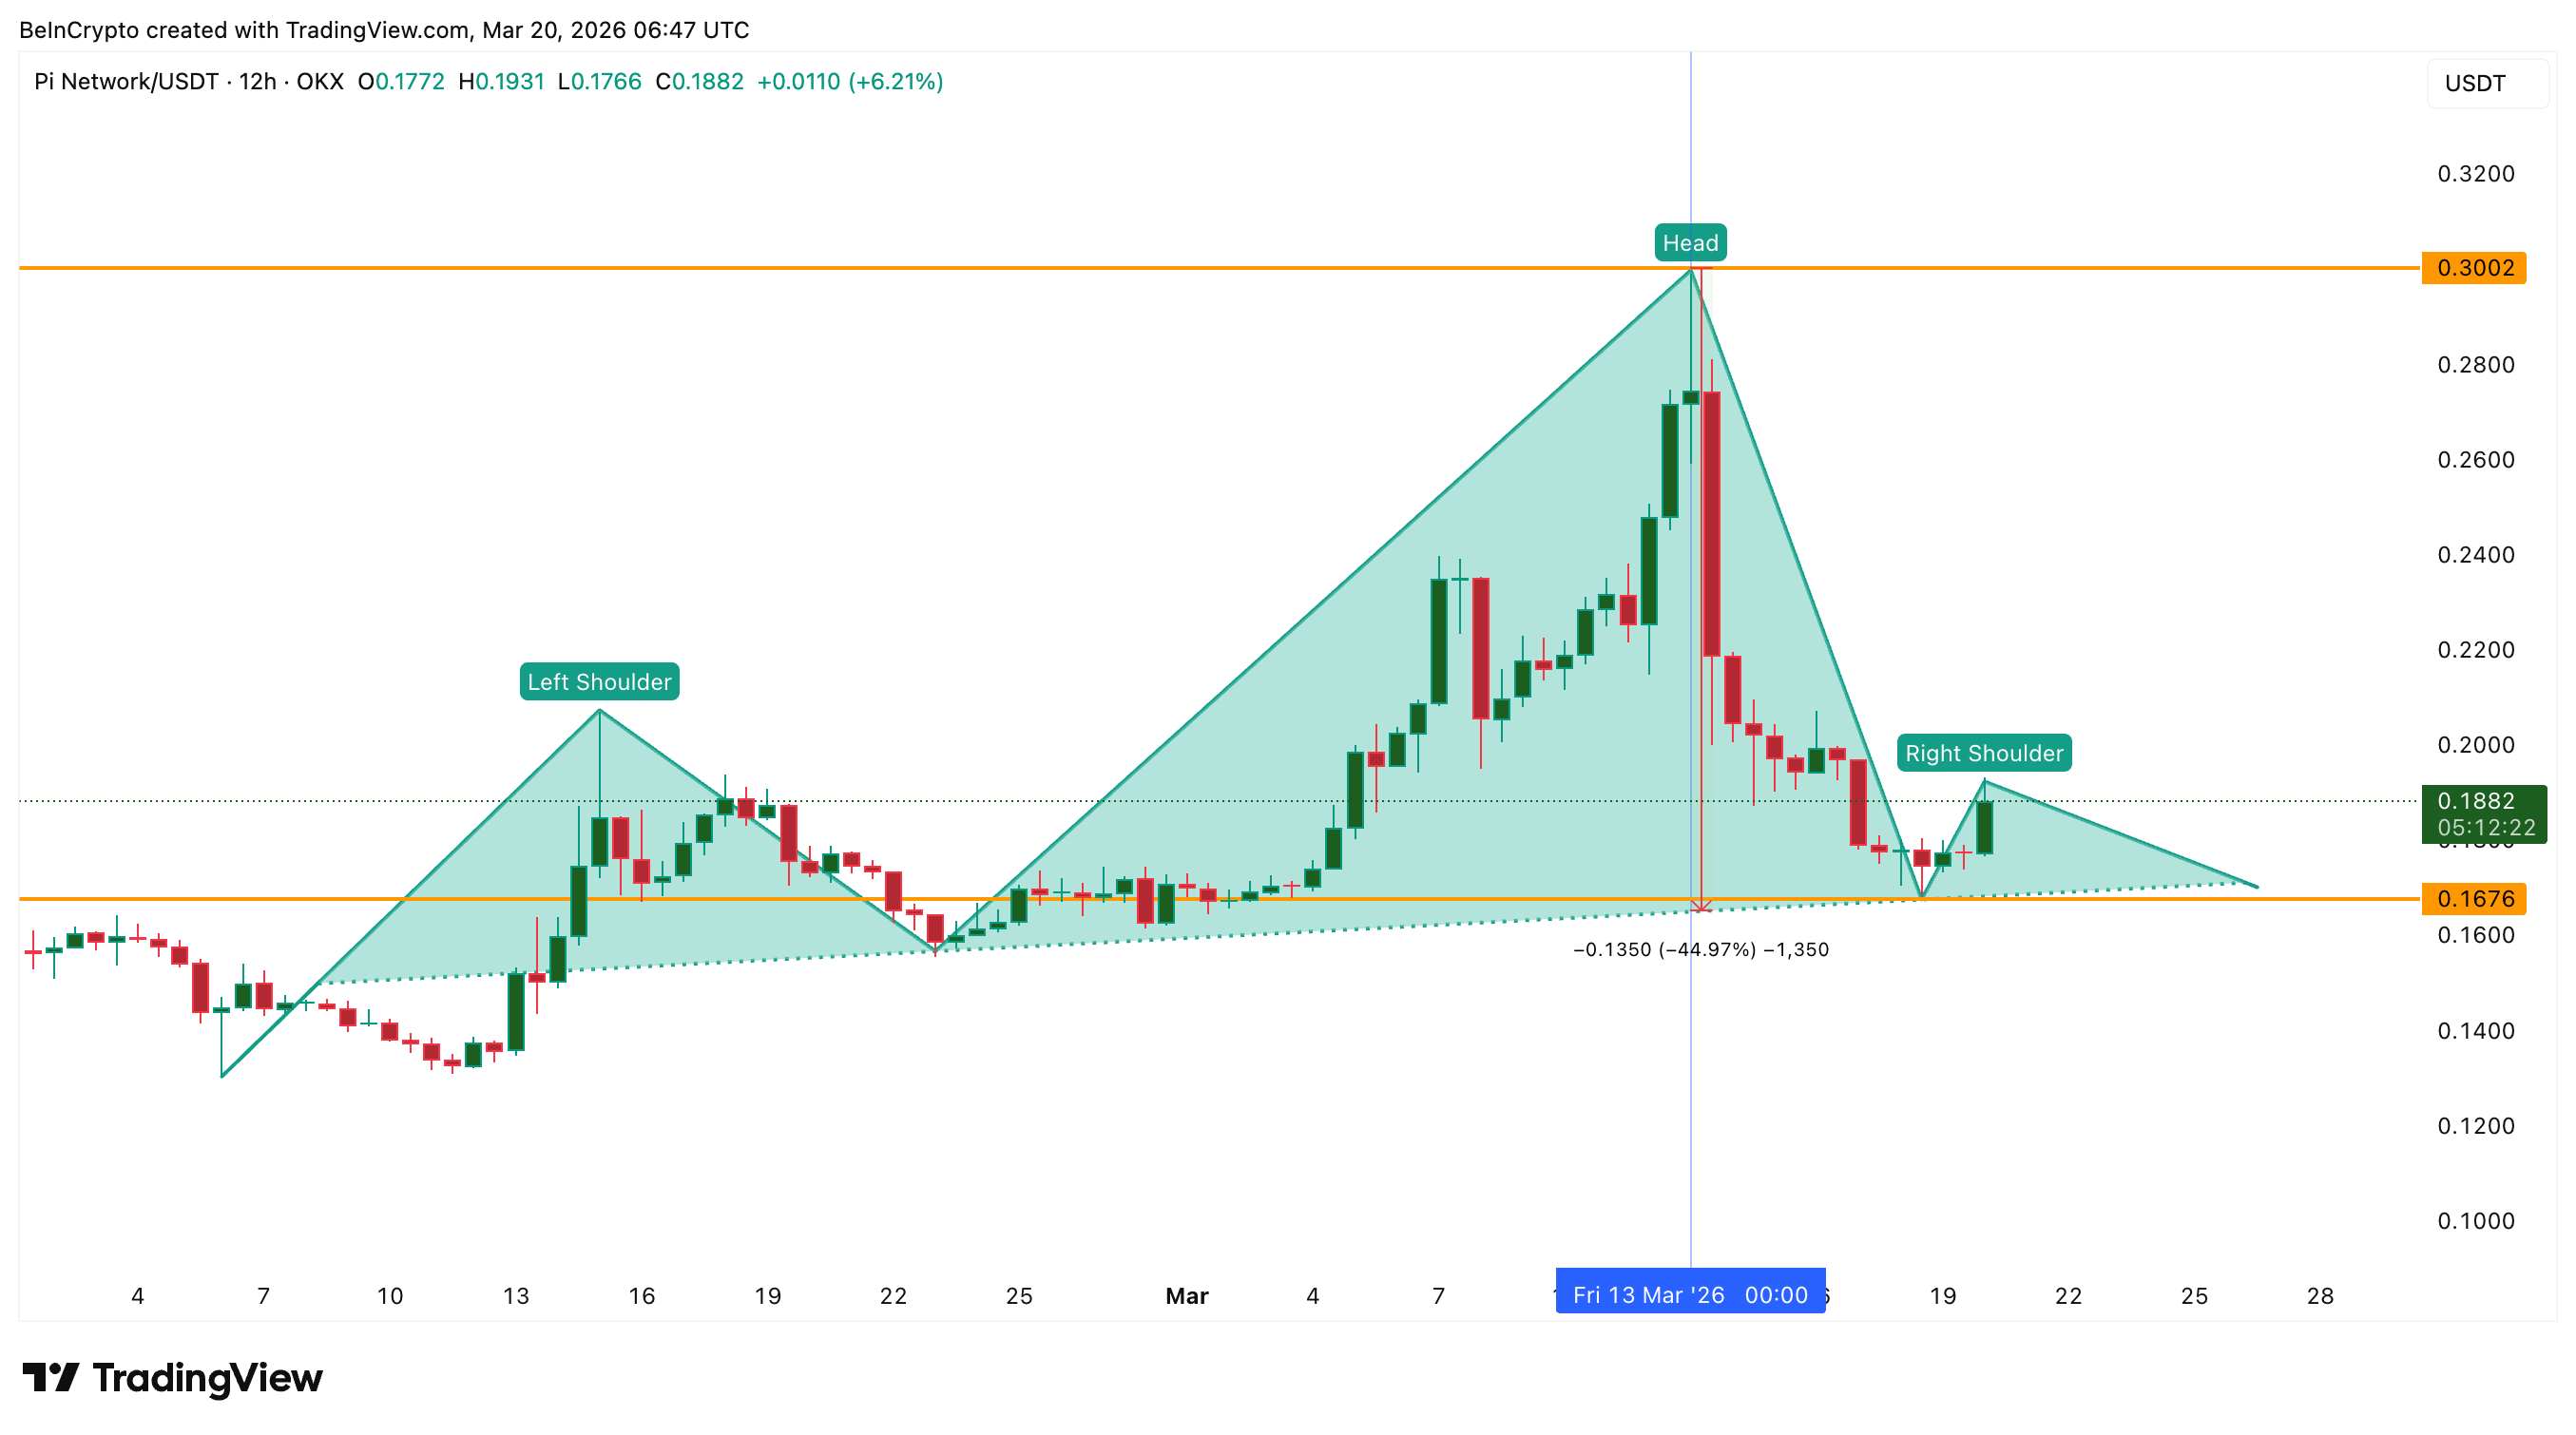 PI Head and Shoulders Pattern: TradingView
Removing the pattern overlay exposes the exponential moving average (EMA) cluster, a trend-following indicator cluster pressing down on PI. The 20-period EMA sits at $0.195, having already crossed below the 200-period EMA at $0.199. It now hovers just above the 50-period EMA at $0.194.
If the 20 EMA slides under the 50, the next reference point becomes the 100-period EMA at $0.189. One bearish crossover has already occurred. A second one would stack multiple sell signals directly above the neckline of the head and shoulders.
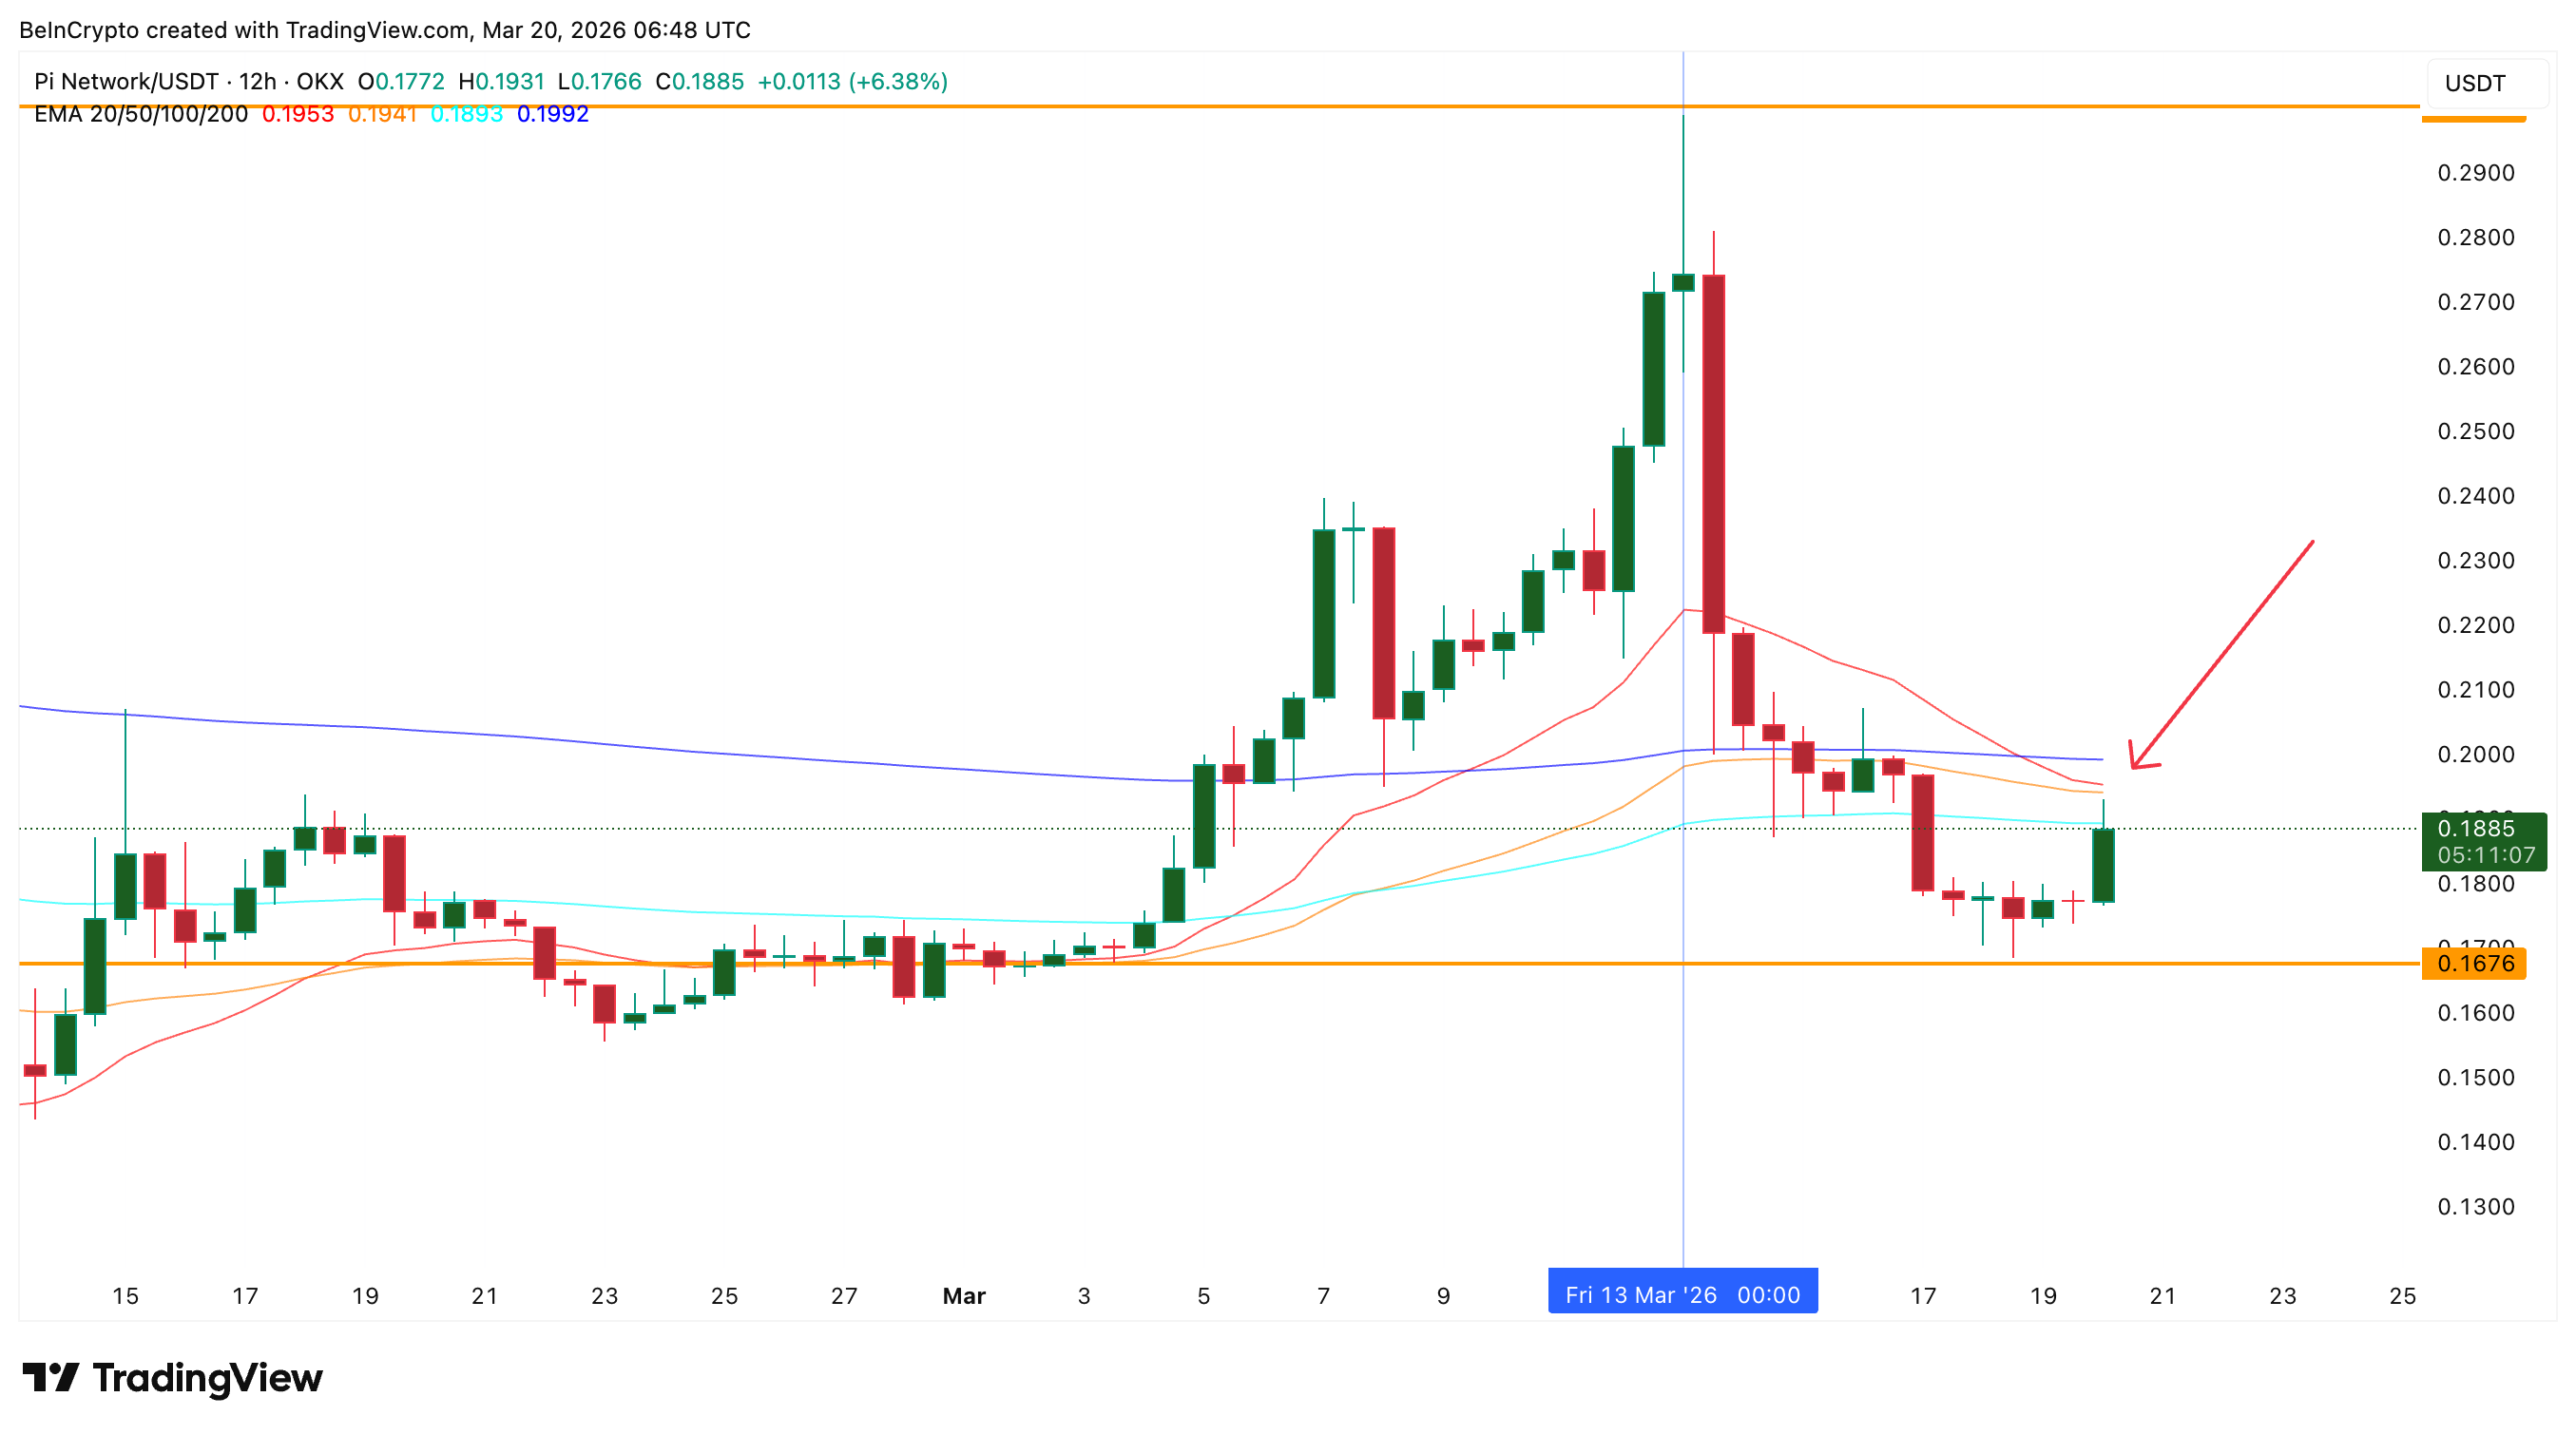 PI EMA Crossover Cluster: TradingView
All four EMAs are compressed between $0.189 and $0.199. When such compression resolves during a downtrend, the resulting move lower tends to accelerate. This momentum weakness, however, tells only part of the story.
Whether buyers still have the appetite to defend PI at these levels depends on sentiment and capital flow data.
Sentiment Offers a Faint Pulse, but Money Flow Tells the Truth
Despite the bearish momentum setup, Pi Coin sentiment has shown a small recovery. Positive sentiment tracked via Santiment rose to 2.13 from nearly zero on March 18. However, that reading sits far below the 6.36 level reached on March 5 and is dramatically lower than the 12.37 peak on March 12.
Historically, local PI sentiment peaks have preceded price rallies. On March 5, when sentiment hit 6.36, PI traded near $0.198. By March 7, the price had gained roughly 20%. The current 2.13 reading is not strong enough to fuel a comparable bounce.
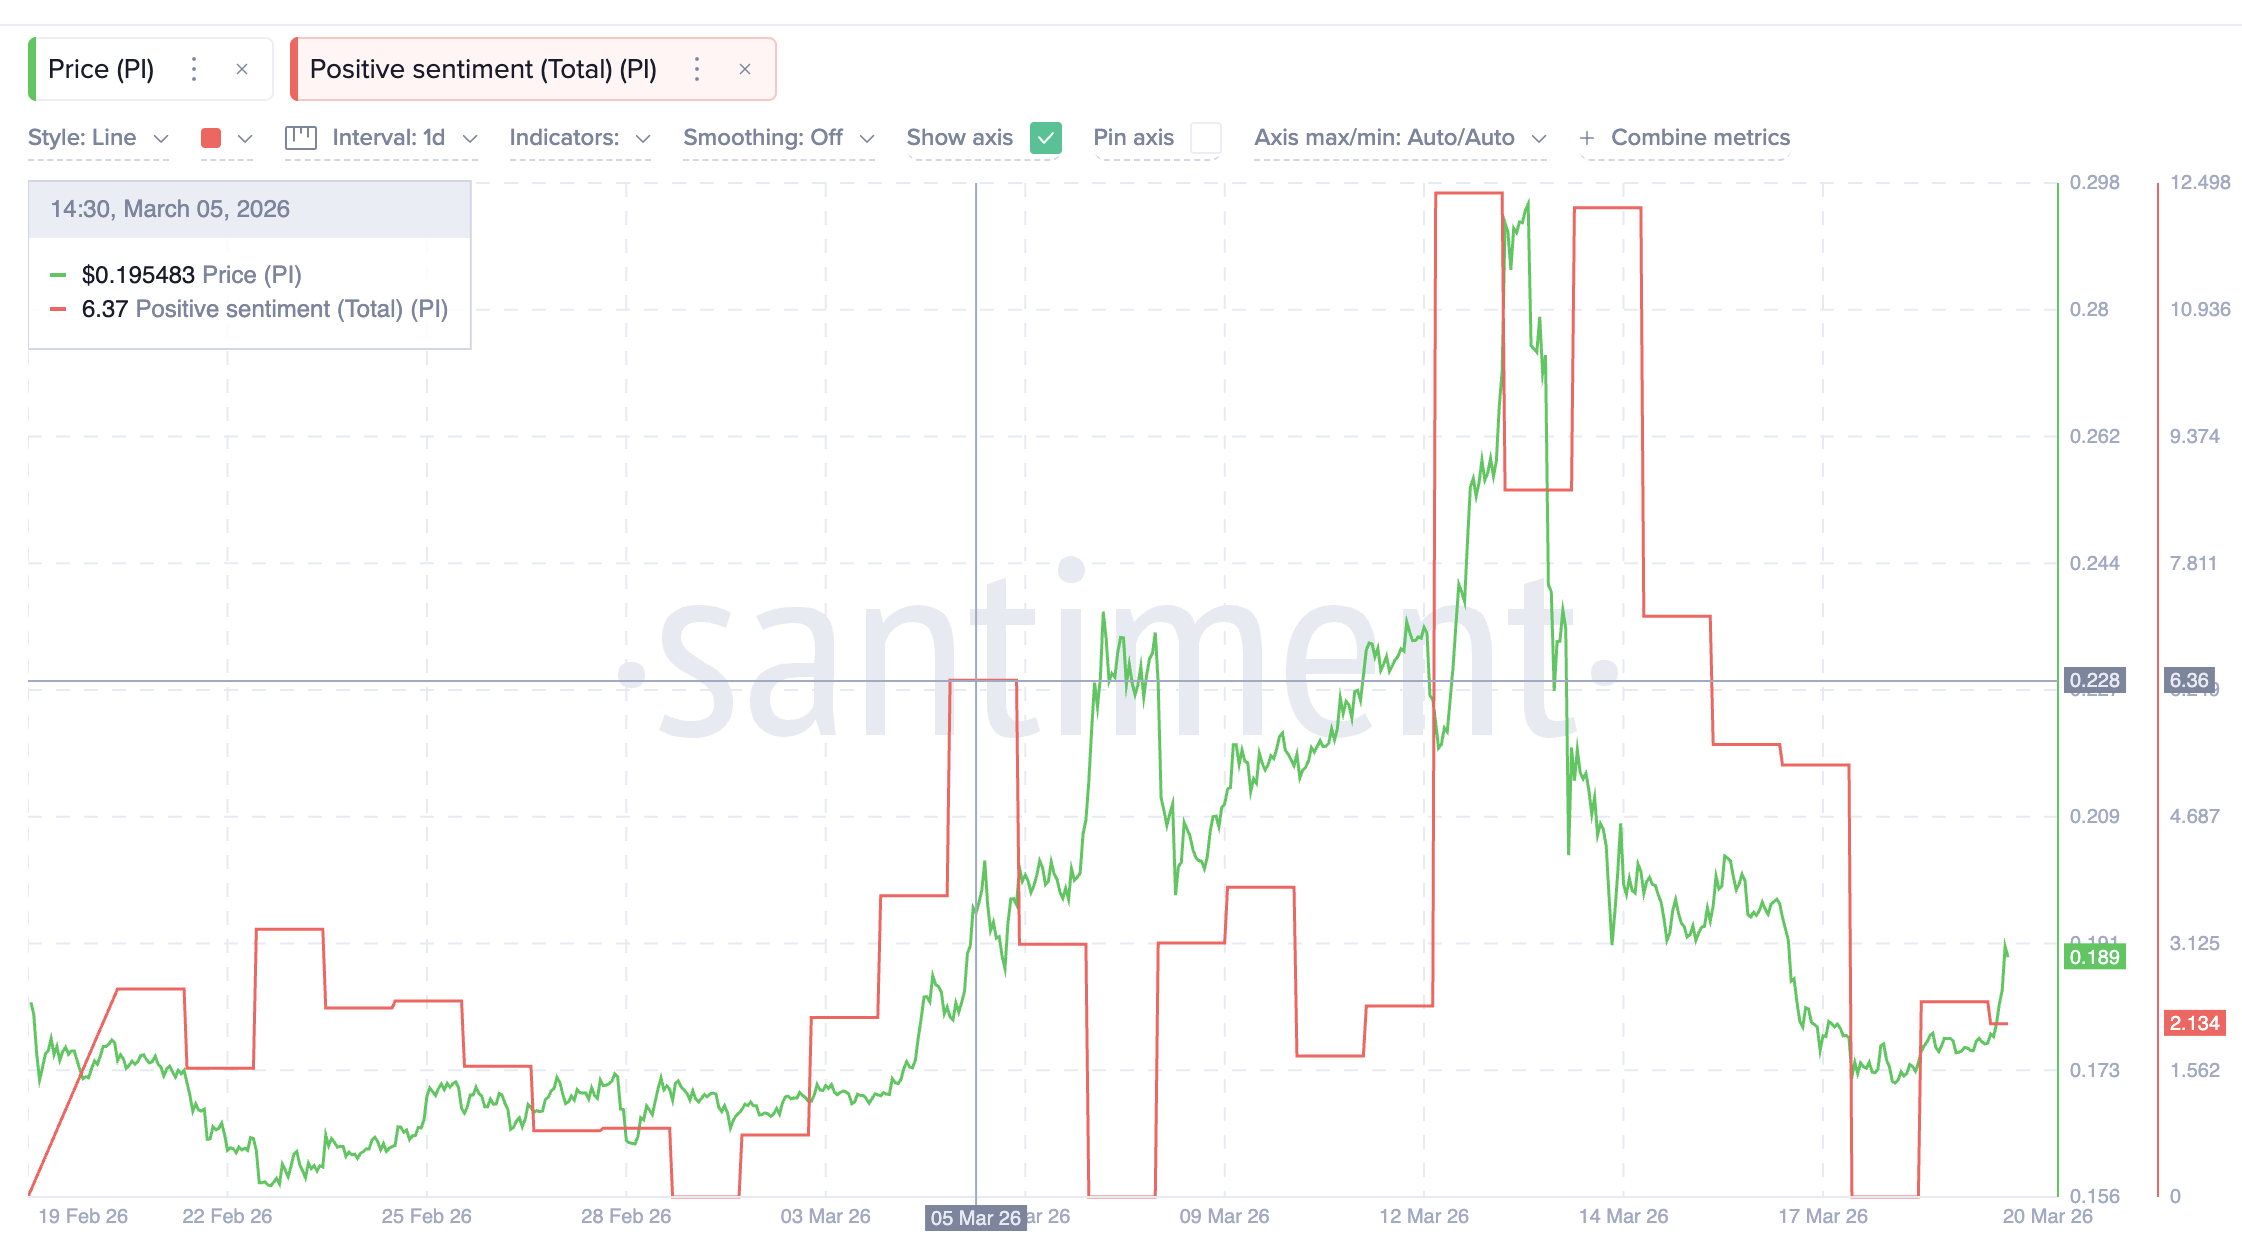 Pi Coin Sentiment and Price Correlation: Santiment
The money flow index (MFI), a volume-weighted proxy for buying and selling pressure, confirms the weakness. MFI has dropped below 25 into oversold territory and currently reads 14.14. On its own, an oversold MFI often precedes a bounce.
Yet a bearish divergence strips that hope away. Between February 28 and March 20, Pi Coin prices trended higher from their lows. During the same window, MFI trended lower. This gap means each successive bounce attracted less capital than the one before it, possibly due to the weakening sentiment. Dip buyers are stepping back, not stepping in.
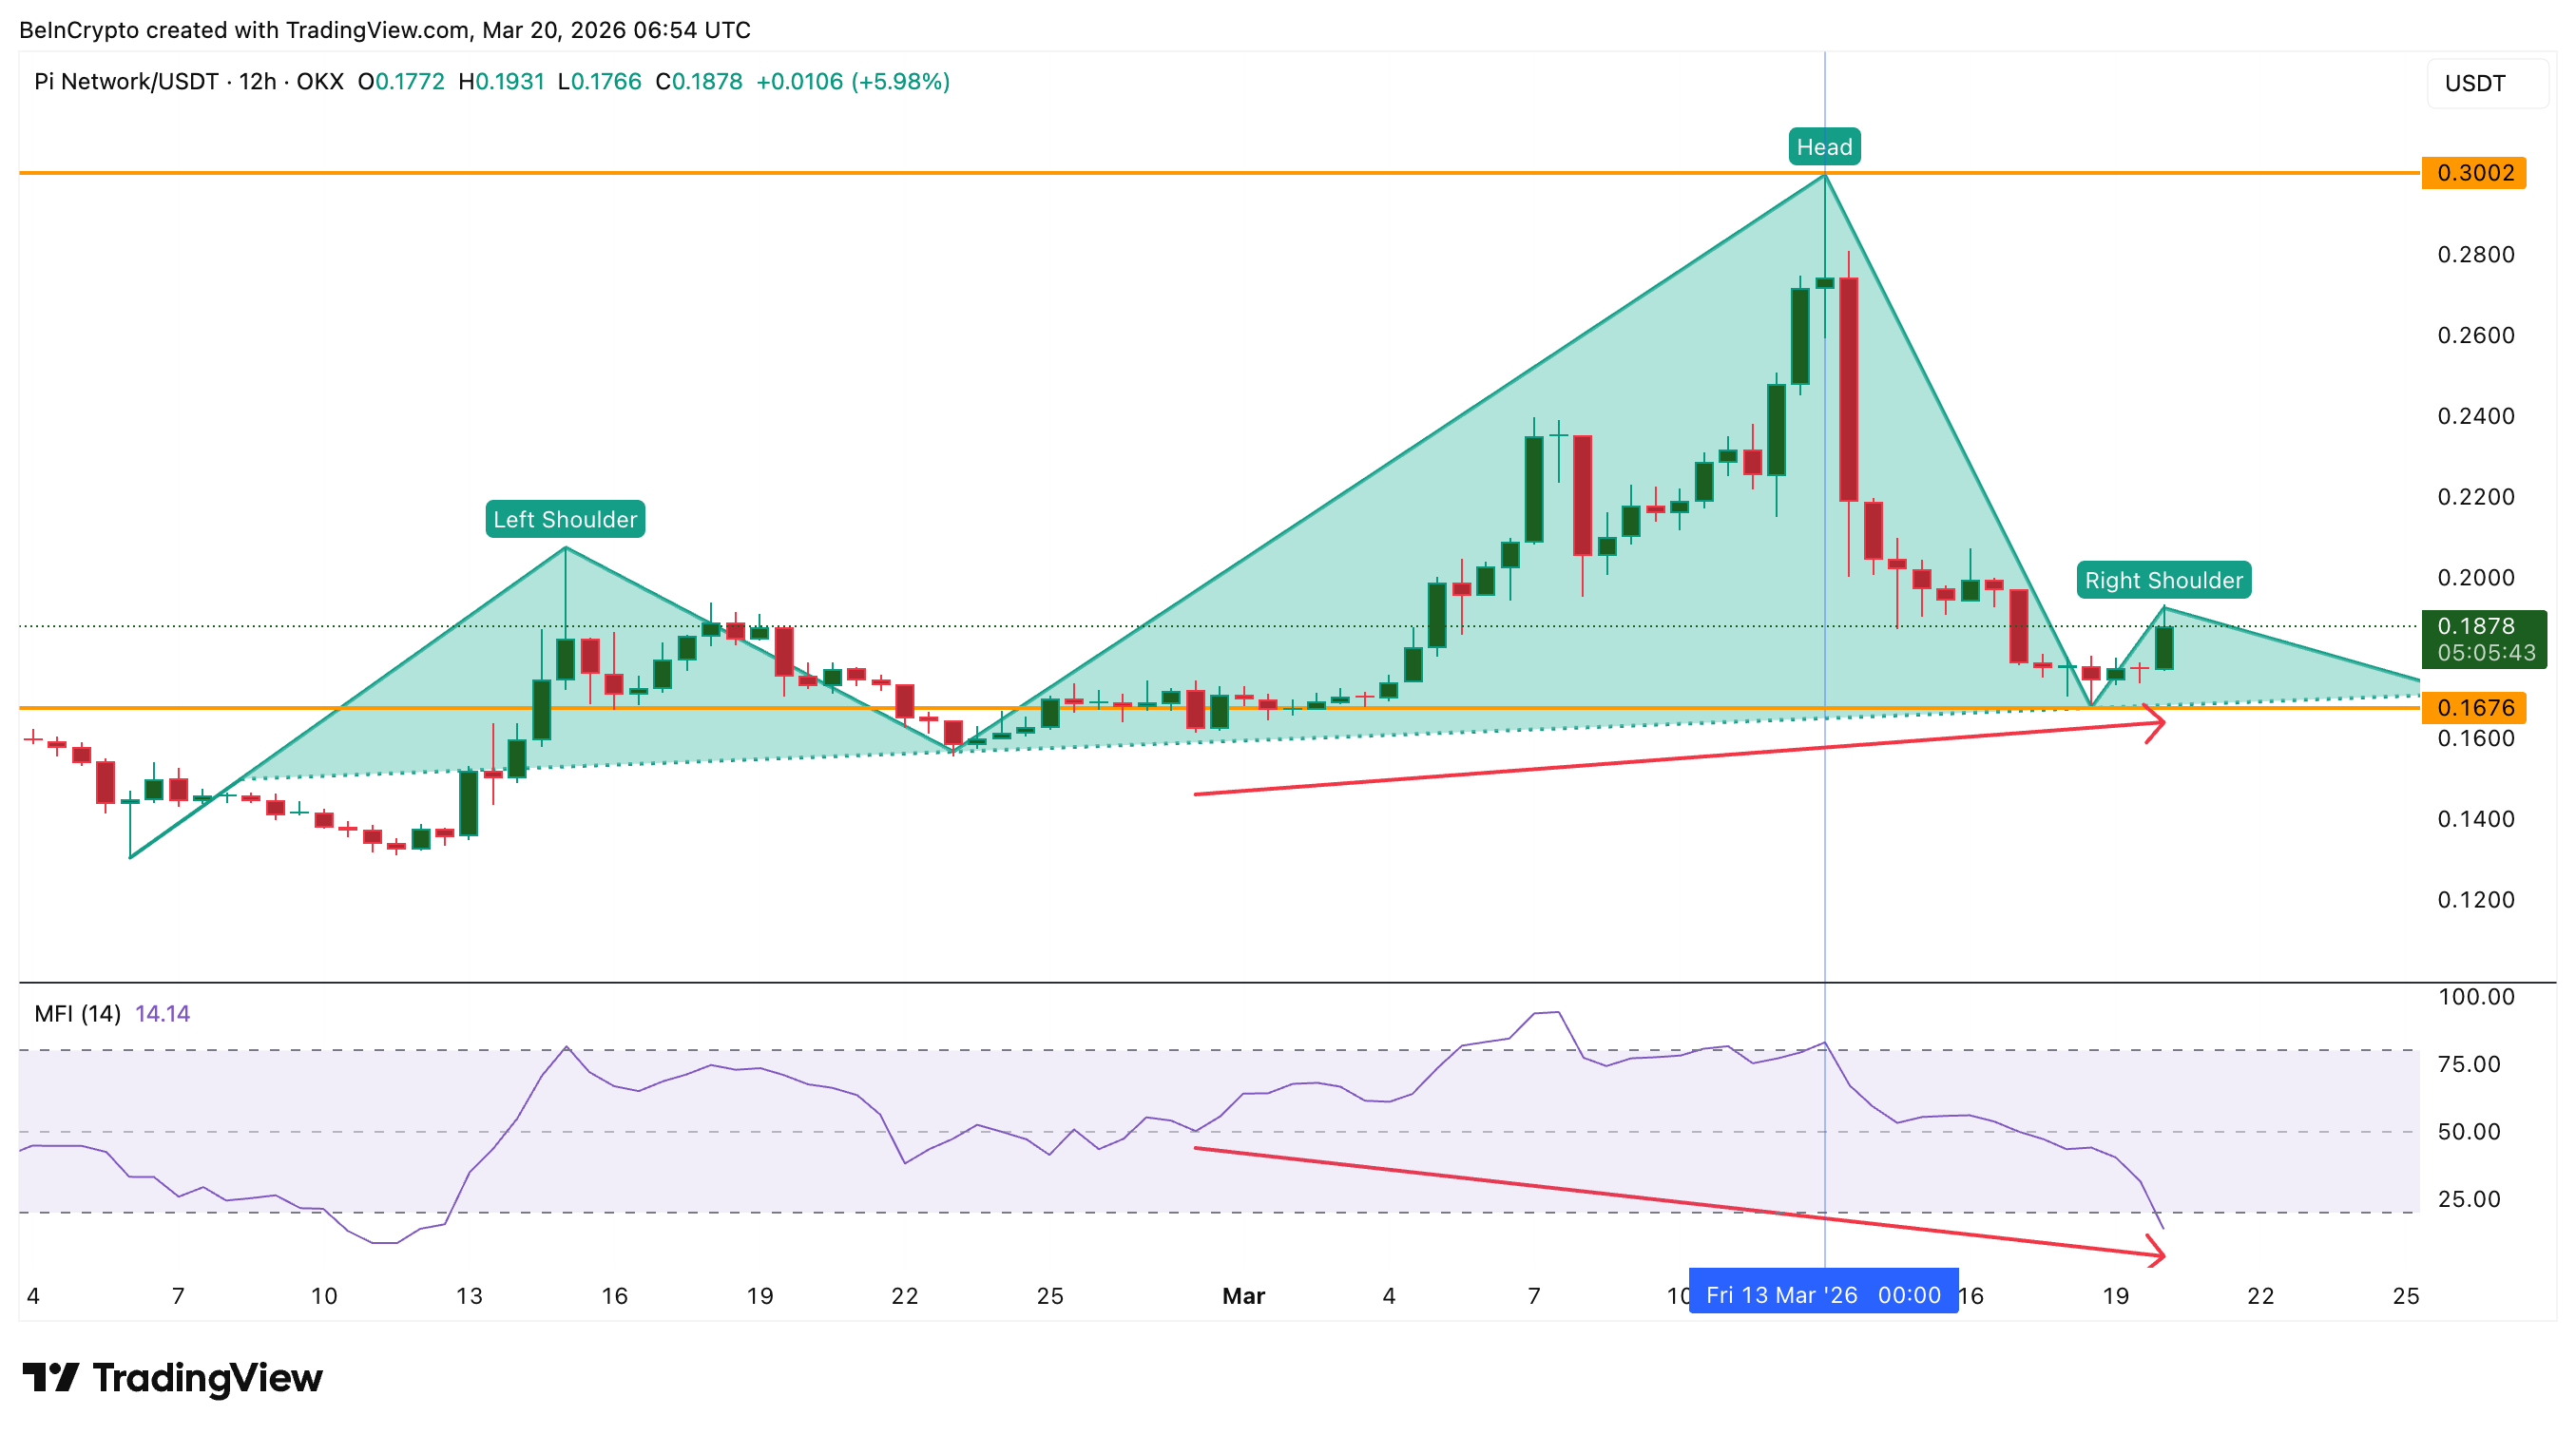 MFI Bearish Divergence: TradingView
Unless MFI reclaims the 25 level and sentiment pushes past at least the March 5 reading of 6.36, any relief bounce risks fading quickly. With momentum, sentiment, and money flow aligned against PI, the price chart becomes the final arbiter.
Pi Coin Price Prediction Hinges on the $0.167-$0.168 Zone
The 12-hour Pi Coin price chart shows PI trading inside the right shoulder, up around 6% on the day. The key zone (now the neckline) at $0.167-$0.168 zone was tested on March 18 and held, but the bounce has so far lacked follow-through from capital.
Head and shoulders patterns do not always confirm as expected. A false breakdown below the neckline could trap short sellers and trigger a sharp squeeze higher. However, the confluence of weakening EMAs, bearish MFI divergence, and fading sentiment reduces the odds of such an invalidation.
For any short-term strength, PI needs a 12-hour close above $0.192 (current right shoulder zone) followed by a reclaim of $0.207. Only if both conditions are met can the bearish thesis be temporarily shelved.
 Pi Coin Price Analysis: TradingView
On the downside, a decisive break below $0.167 unlocks the full 45% measured move toward $0.093. Even a partial decline to $0.128 would set a new all-time low for the Pi Network token, surpassing the $0.131 record from February 2026.
The $0.167 neckline now separates a potential relief rally toward $0.207 from a devastating 45% plunge to $0.093.
0
0


 Manage all your crypto, NFT and DeFi from one place
Securely connect the portfolio you’re using to start.

0
0

0
0

0
0
