0
0
XRP’s price has tested market patience for weeks. It is down about -18% over the past month and nearly -4% in the past 24 hours.
The coin has spent most of this stretch stuck in a tight range, which has kept trading quiet and sentiment low. Buyers and sellers are still moving within the same band, and that has kept momentum from building.
A meaningful bounce, if it comes, also needs less selling. Long-term holders, who usually act as the steady base of the market, have pulled back sharply on their distribution.
DISCOVER: 9+ Best Memecoin to Buy in 2025
As per Glassnode data, on December 3, they sent out 101,083,156 XRP. By December 10, that number dropped to 51,157,301 XRP. That is close to a -49% fall.
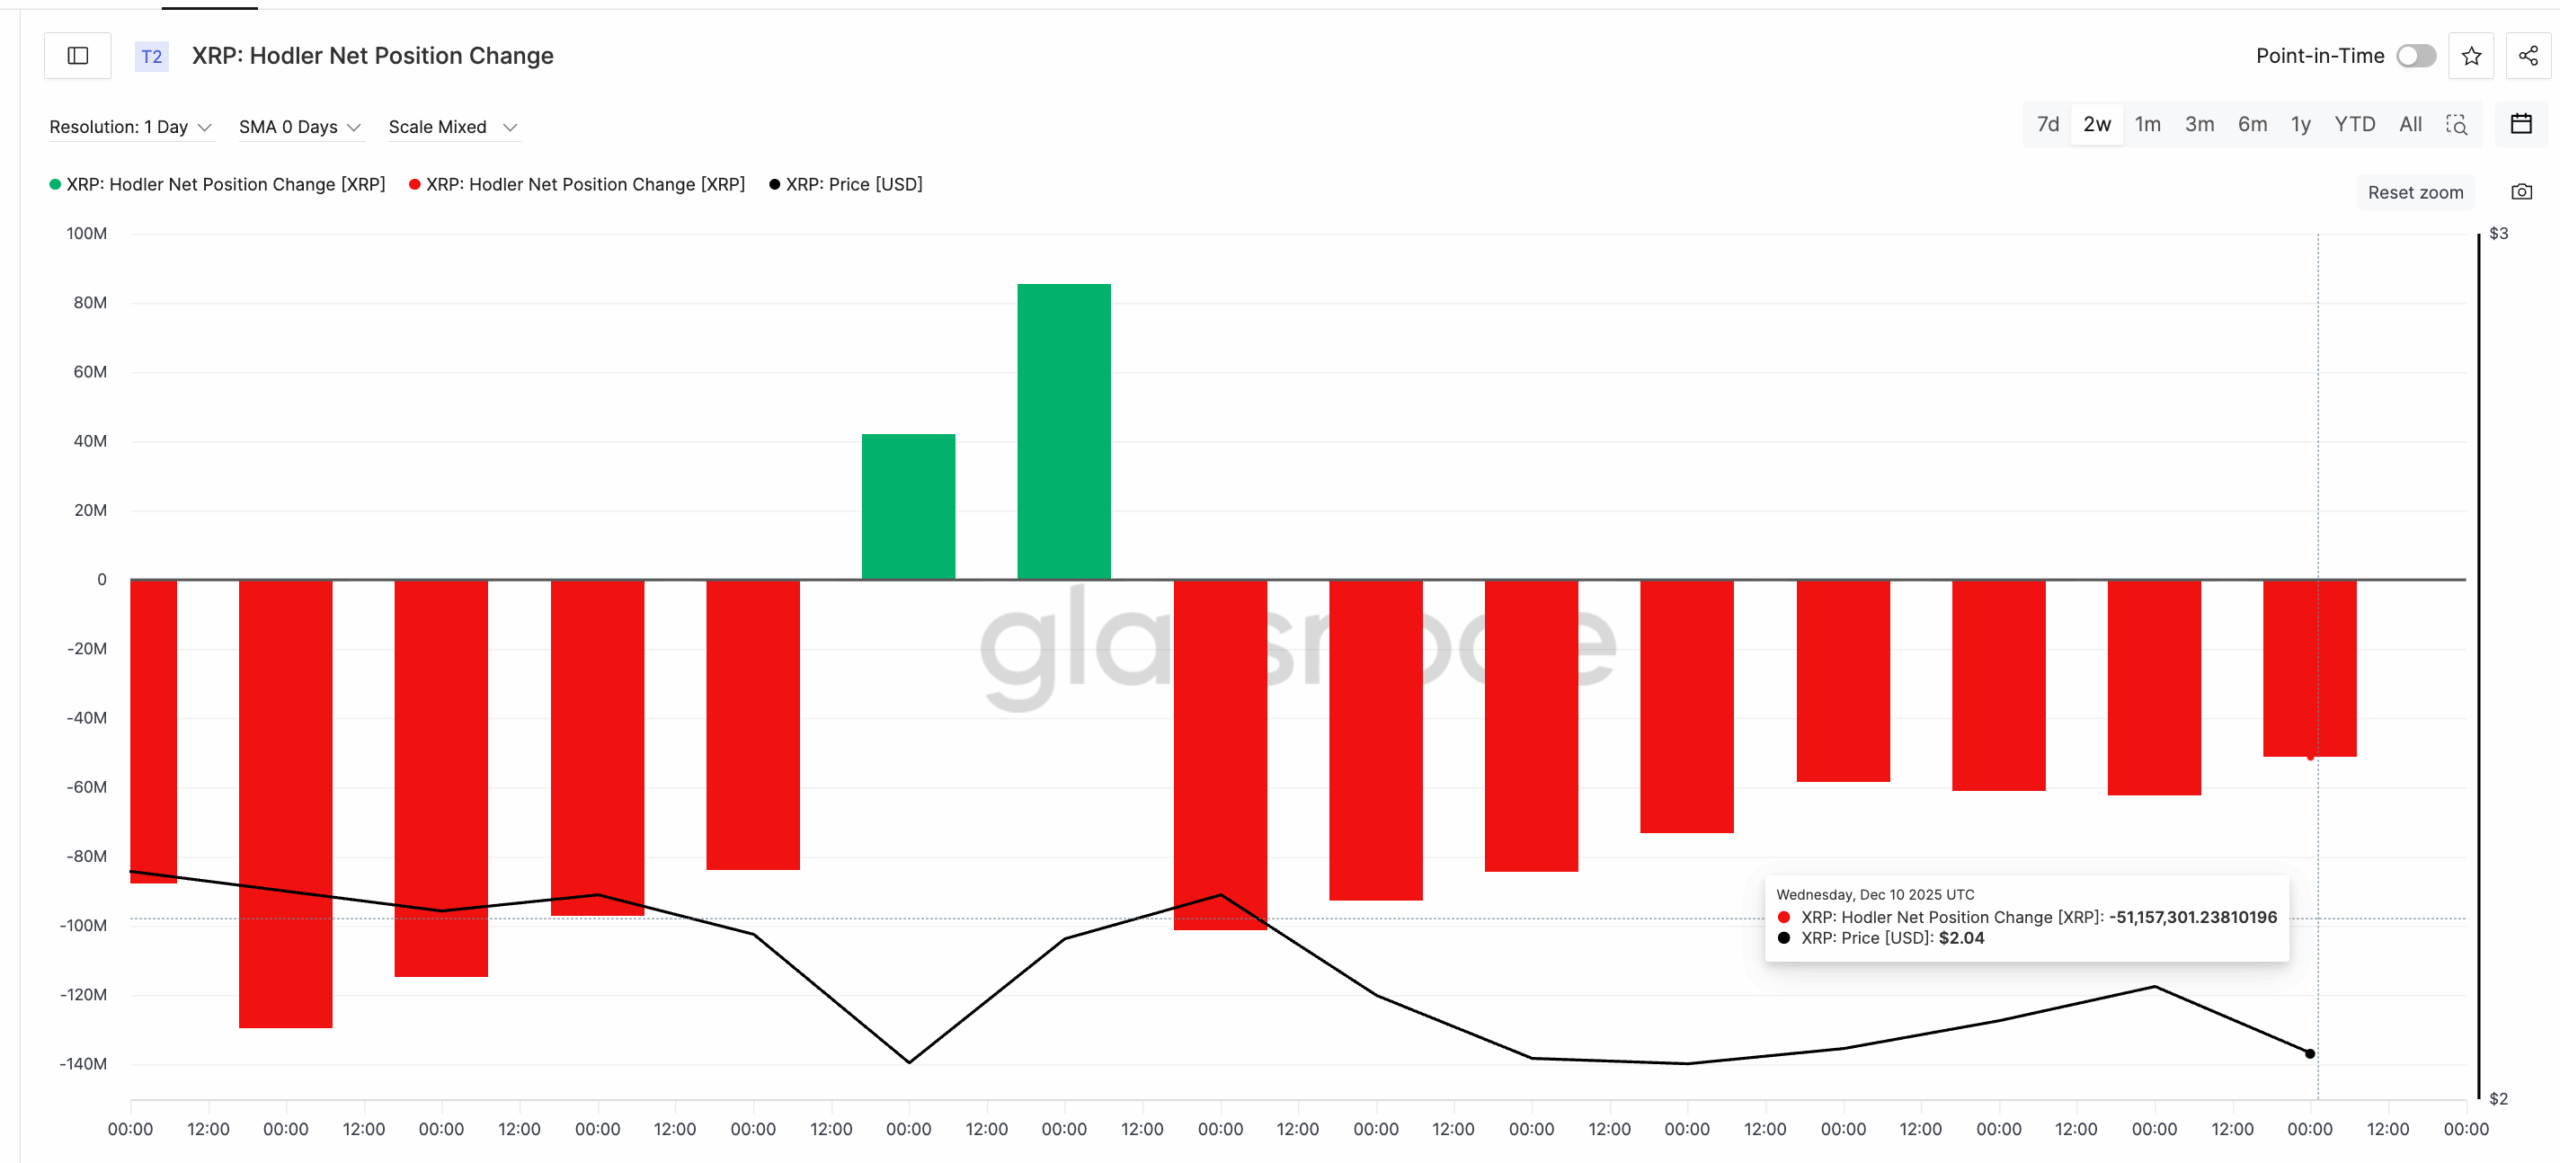
They are still selling, but the slowdown is clear and worth attention as the market looks for its next move.
Another important shift is coming from the fastest-moving wallets. These short-term holders usually sell into every small rally and break momentum before it grows. This time, they are cutting supply instead, a sign that pressure from quick traders may be easing.
XRP’s short-term holders are now pulling back supply. The shift shows up clearly in the HODL waves metric, which tracks how much of the circulating supply each age group controls. The 24-hour cohort held 1.89% of the supply on December 2.
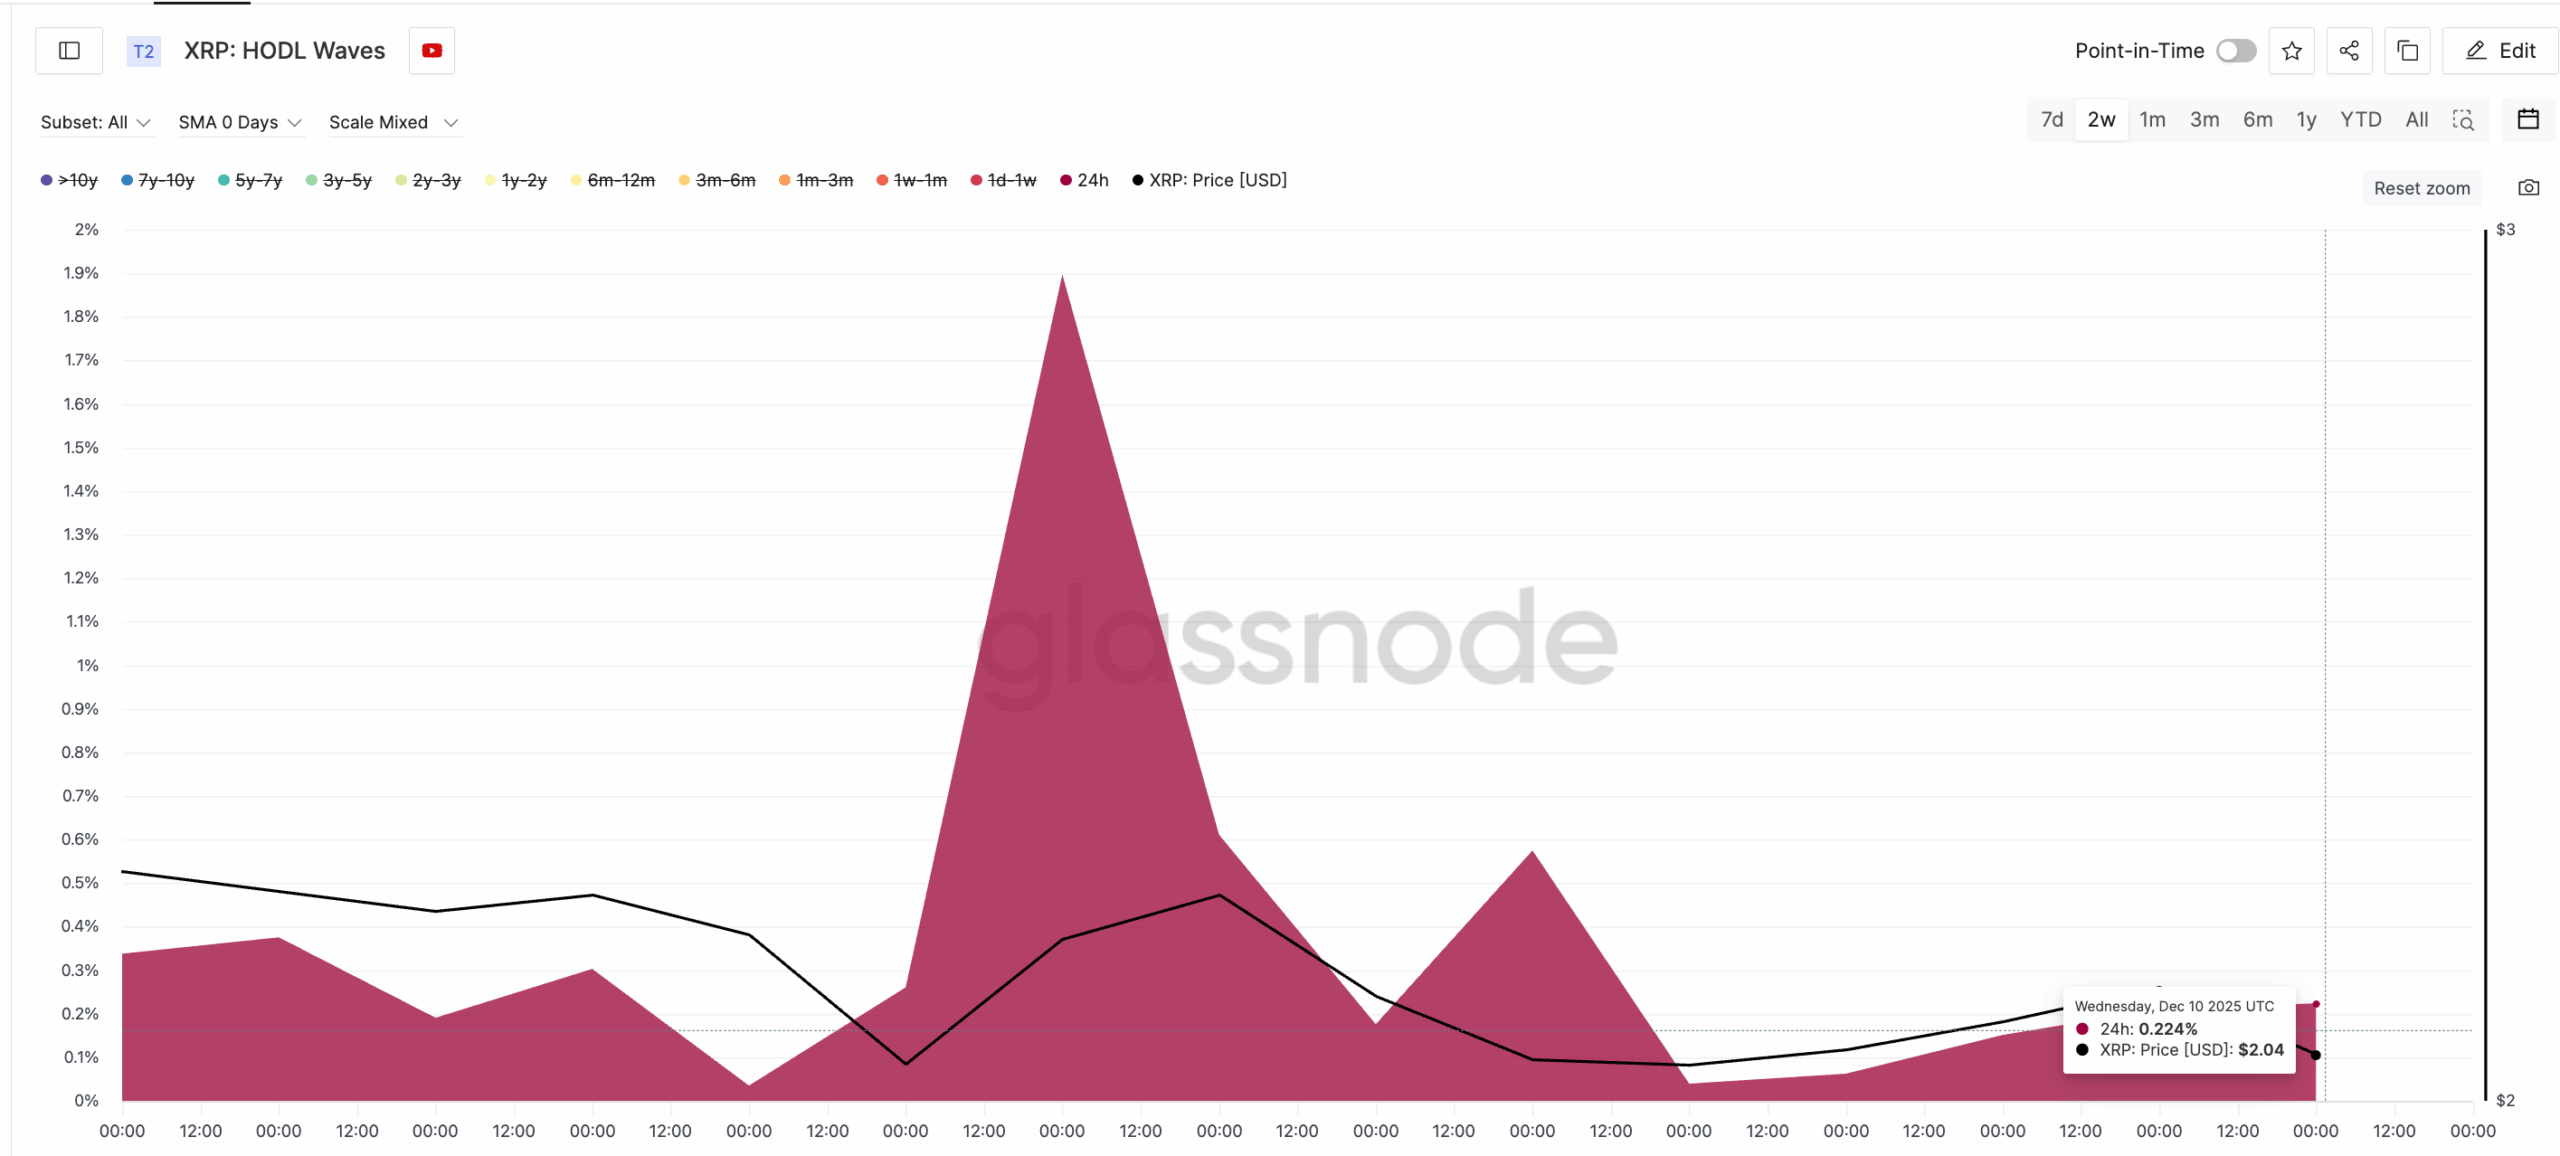
By December 10, that number dropped to -0.22%. It’s a steep fall and signals a clear change in how fast-moving wallets are behaving.
DISCOVER: The 12+ Hottest Crypto Presales to Buy Right Now
At the same time, XRP is building one of its strongest long-term breakout structures in years. The pattern on the higher timeframe looks almost identical to a previous setup.
The analyst who shared the chart on X said, “$XRP chart is screaming… are we really heading toward $27?” His comment points to a structure that also formed before XRP’s last major rally.
The chart shows two similar accumulation phases. The first appeared between 2015 and 2017. In that period, XRP moved through an ABC corrective pattern inside a broad demand zone before it broke out with force.
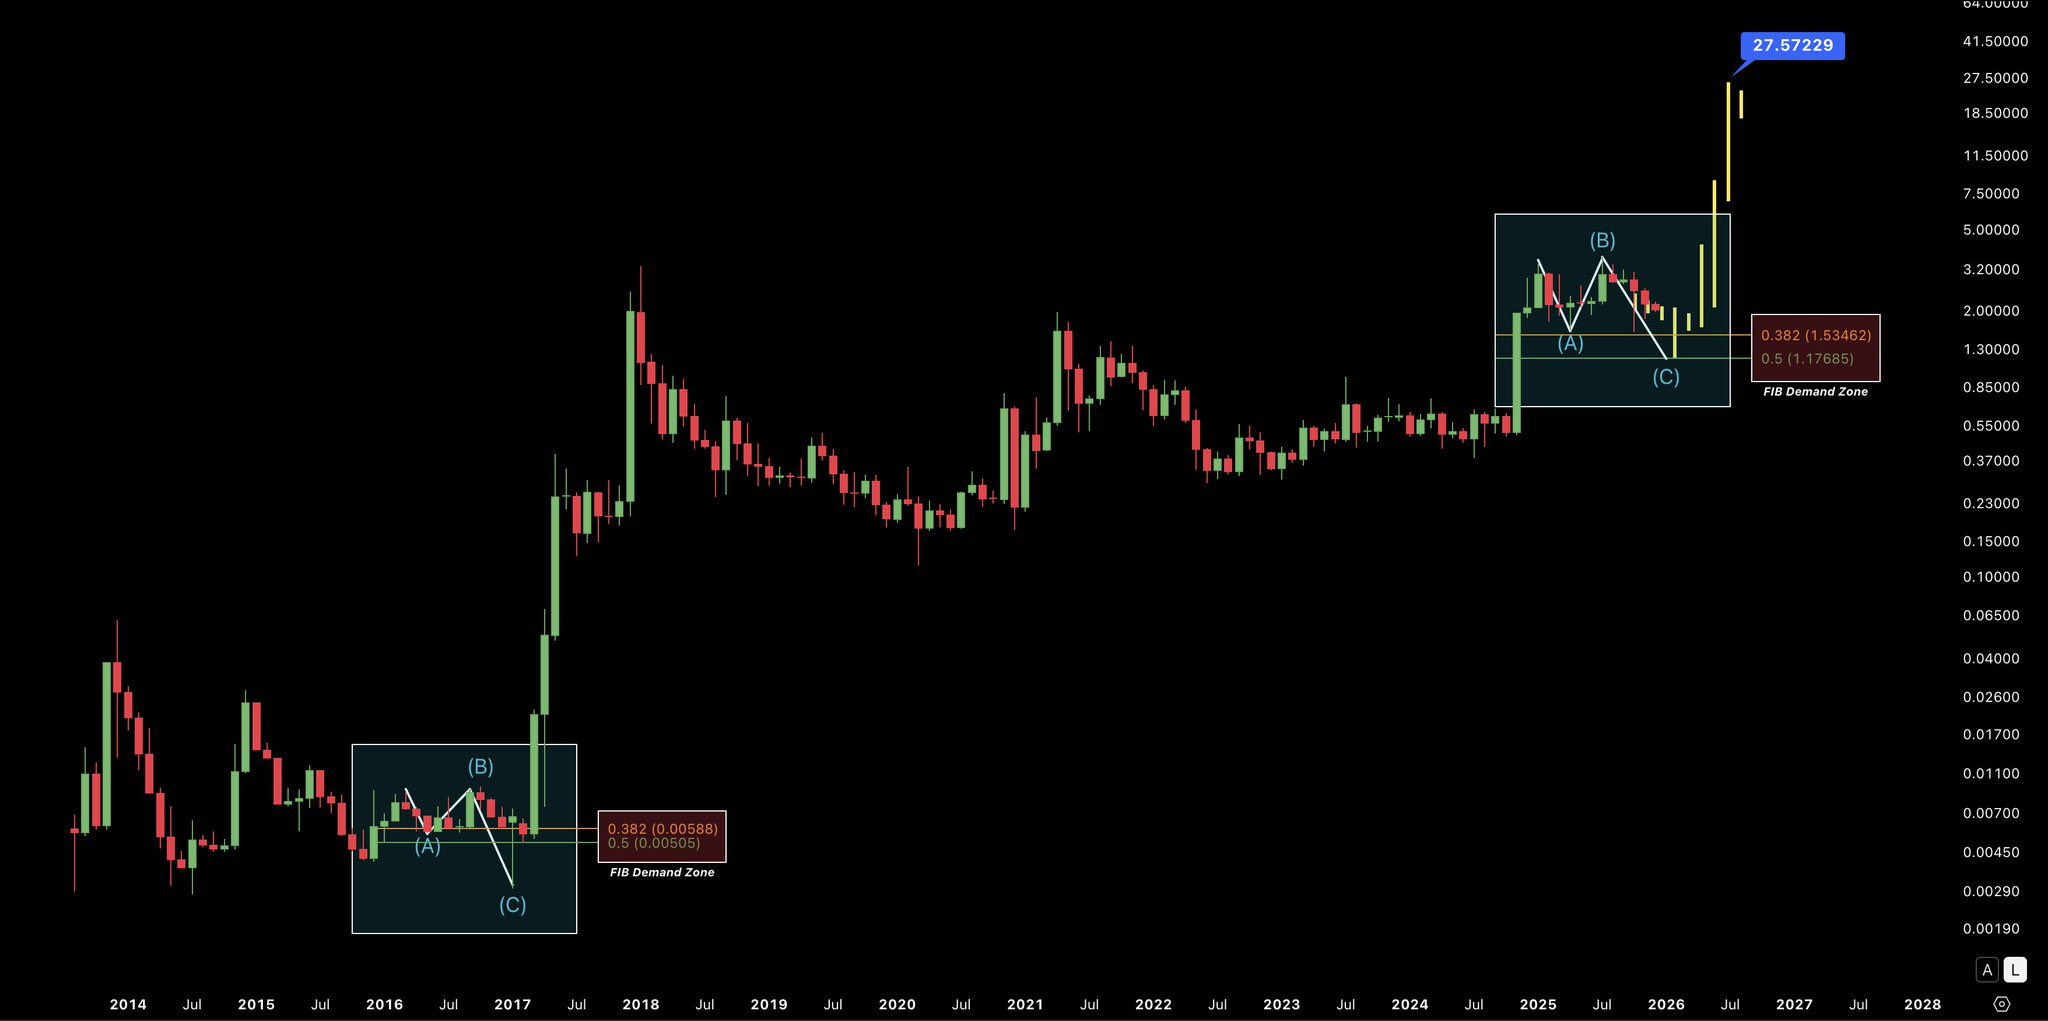
The structure on the right shows the same ABC pattern forming again between 2023 and 2025.
Price has pulled back into the 0.382–0.5 Fibonacci demand zone and is now pushing higher from that area.
The recent candles show a clean move out of the zone, which signals fresh buying pressure. The breakout looks similar to the early stage of XRP’s 2017 run, when the chart turned vertical after clearing key resistance.
Momentum is picking up again, and the broader trend leans bullish as long as XRP stays above this Fib demand band.
Technical projections on the chart point to a possible target near $27.57. This level matches the measured move seen in the previous cycle.
The setup suggests that if XRP follows its past behavior, it may be entering another macro expansion phase.
DISCOVER: Best Meme Coin ICOs to Invest in 2025
The post XRP Price Prediction: Is XRP Preparing for a Major Breakout as Selling Pressure Drops Nearly -50%? appeared first on 99Bitcoins.
0
0
 Manage all your crypto, NFT and DeFi from one place
Securely connect the portfolio you’re using to start.

0
0


0
0