
Polkadot Price Prediction: $DOT Volume Explodes, Bulls Eye $2 Next?

0
0

Polkadot is exploding back into crypto conversation as traders refresh the chart nonstop.
$DOT just posted a massive volume surge right after pulling back from recent highs.
This Polkadot Price Prediction breaks down the chart and key levels, deciding where $DOT heads next.
Polkadot is a multi-chain network that lets blockchains share security, per the project's own materials. Stick around till the end.
DOT Price Prediction Today: Market Snapshot at a Glance
| Metric | Value |
| Price | $0.86029 |
| 24h Change | -0.79% |
| Market Cap | $1.46B (-0.78%) |
| Unlocked Market Cap | $1.5B |
| FDV | $1.8B |
| 24h Volume | $135.8M (+55.38%) |
| Vol/Mkt Cap (24h) | 9.32% |
| Total Supply | 1.7B DOT |
| Max Supply | 2.1B DOT |
| Circulating Supply | 1.7B DOT |
Source: Data from CoinMarketCap as of 2 September, 2026, at 1:42 IST. Figures may vary slightly across other tracking websites.
$DOT Price Prediction: Crypto Update Today
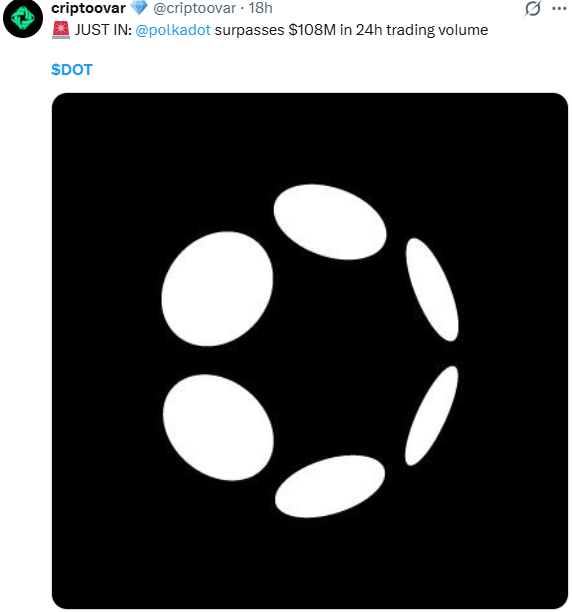
Source: Data From X
Polkadot's 24-hour trading volume has surpassed $108 million, signaling increased market activity around $DOT.
Reading the $DOT Chart: What This Week's Technical Analysis Shows
Pair: DOT/USD · Market: Spot (Crypto) · Timeframe: 1D · Source: TradingView · Timestamp: September 2, 2026, 12:31 UTC+5:30
On the daily chart , the price is trading at $0.86029, right on top of a tight cluster of moving averages that has acted as support through the past few days.
The key is for the price to break out of the channel with a bullish move, similar to the previous channel breakout, to support further upside.
RSI is reading in the mid-53, in neutral-to-mildly-bullish territory, suggesting the pullback hasn't broken the underlying momentum yet.
As long as DOT holds above that cluster, the recent uptrend stays technically intact, and this DOT price prediction this week leans toward continuation rather than breakdown.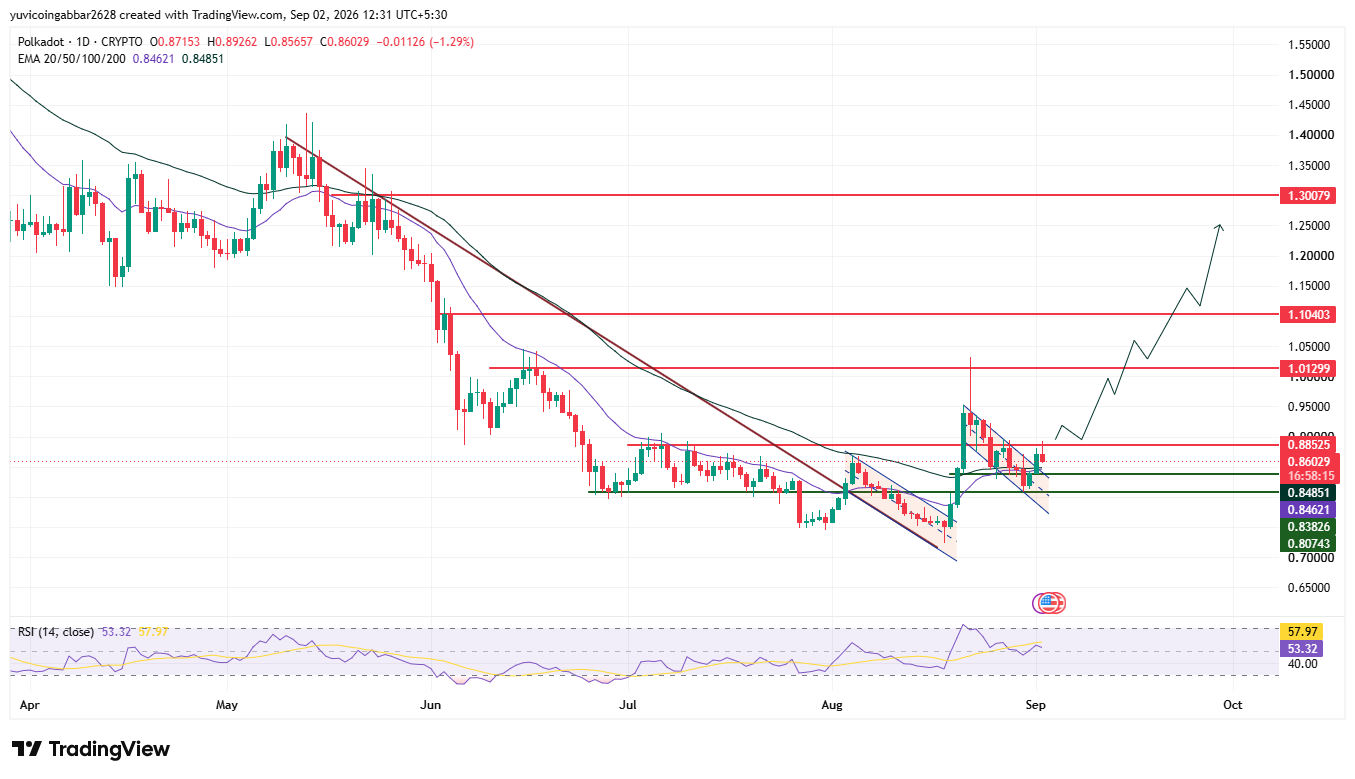
DOT Price Prediction: Key Levels
| Level Type | Price |
| Resistance 4 | $1.30079 |
| Resistance 3 | $1.10403 |
| Resistance 2 | $1.01299 |
| Resistance 1 (nearest) | $0.88525 |
| Immediate Price Reference | $0.86029 |
| First Confirmed Support | $0.84851 |
| Deeper Support | $0.83826 |
| Structural Floor | $0.80743 |
Polkadot Bull Run or Breakdown?
Bull case: Holding the EMA cluster near $0.846 to $0.849 and reclaiming the nearest resistance at $0.88525 would put the next test at $1.01299 back in play, with $1.10403 as the level after that.
Bear case: A daily close below the EMA cluster would put the current support in question.
Losing $0.83826 would expose the structural floor at $0.80743 as the next downside level to watch.
Can $DOT Blast Through $1.30?
$1.30079 is the highest resistance marked on the current chart.
Getting there would require $DOT to first clear $0.88525, then $1.01299, then $1.10403, a multi-stage move rather than a single leg, and each level would need to be confirmed with a hold, not just a brief touch.
This is the $DOT coin price levels 2026 traders keep bringing up, though it's still a long way off from current levels.
What the Experts Are Watching in This $DOT Price Prediction
According to CoinGabbar analysts , The pullback looks orderly, not aggressive, with $DOT holding right on its EMA support cluster.
The volume jump, confirmed by two separate sources, points to fresh trading interest rather than a quiet drift lower.
The $0.846 to $0.848 zone is the battleground: hold it and the recovery thesis stays alive.
Disclaimer
This piece is for informational purposes only and isn't financial advice. The levels and scenarios above are based on technical chart analysis and publicly available data at the time of writing, and crypto markets can move sharply within hours, so past patterns don't guarantee future outcomes. It's worth doing independent research and considering your own risk tolerance before acting on any of the levels discussed here.
0
0

 从同一位置管理所有加密资产、NFT 和 DeFi 资产
安全地关联您正在使用的投资组合,以开始交易。


