
Ethereum Price Could Hit $3,000 This Week, Top Analyst Explains Why

0
0

Analyst Believes Ethereum Price Could Reach $3K This Week, Here Is Why
Ethereum price today is trading just above $2,500, down a small 0.27% on the day. The Ethereum price prediction picture is getting more interesting as three major events line up in the same week. Analyst Ali Charts says a weekly close above $2,550 could open the door to $3,000.
Right now the price sits around $2,512, based on the latest derivatives data. Bitcoin is near $77,500. XRP trades around $1.38. Solana holds near $101.32.
This week could shake up the whole market. Here's what traders are watching.
What Are Bitcoin, XRP, and Solana Doing Today?
ETH is not moving alone. The wider market is holding steady ahead of this week's events.
Coin | Price |
Bitcoin (BTC) | ~$77,500 |
Ethereum (ETH) | ~$2,512.79 |
XRP | ~$1.38 |
Solana (SOL) | ~$101.32 |
These assets tend to move together, so a big Fed reaction in Bitcoin could spill over into ETH too.
What Is Ethereum Price Today?
As of writing, the price is $2,512.79, slightly down 0.27% on the day.
Metric | Value |
ETH Price | $2,512.79 |
24h Futures Volume | $37.42B |
Open Interest | $32.42B |
24h Long/Short Ratio | 0.9646 |
Options Volume (24h) | $1.56B |
Options Open Interest | $7.36B |
24h Liquidations | $66.03M |
Long positions took the bigger hit in the last 24 hours. About $53.63M in longs got liquidated, compared to $12.40M in shorts. That tells us leveraged buyers got caught off guard by the recent pullback.
Binance top traders still lean long, with a ratio of 1.3753. So while regular traders are a bit split, the bigger players seem to expect more upside.
Why Is ETH Price Moving This Week?
Three events are stacking up close together, and each one could move the market on its own.
September 15: The CLARITY Act faces a procedural vote in the Senate. Senator Cynthia Lummis posted "Big things are coming" on social media ahead of the vote, and many in the crypto space think she's hinting at this bill.
September 16: The Federal Reserve wraps up its two-day meeting. Odds from the FedWatch Tool put the chance of a 25 basis point hike at 86.5%. Just a month ago, those odds were only 33.9%. That's a huge shift in a short time.
September 18: The Bank of Japan meets and may raise rates too. A stronger yen could pull money away from US assets tied to the yen carry trade, which includes crypto.
Target Rate (bps) | Now | 1 Week Ago | 1 Month Ago |
350-375 (current) | 13.5% | 40.6% | 66.1% |
375-400 (hike) | 86.5% | 59.4% | 33.9% |
If the Fed hikes rates and markets haven't fully priced it in, Bitcoin, ETH, and XRP could all feel pressure.
Why Does the Bank of Japan Meeting Matter for Crypto?
The BOJ meets September 18, two days after the Fed. If Japan raises rates, the yen could strengthen.
A stronger yen tends to pull money out of the yen carry trade, where investors borrow cheap yen to buy other assets, including US stocks and crypto. A fast unwind could add extra selling pressure right when the Fed decision is still fresh.
What Is the CLARITY Act and Why Does It Matter for ETH?
The CLARITY Act faces a procedural Senate vote on September 15. This bill deals with how digital assets are regulated in the US, and clearer rules are generally seen as good for crypto prices.
Senator Cynthia Lummis posted "Big things are coming" ahead of the vote without giving details. Many traders read that as a hint tied to this bill, though nothing is confirmed.
Ethereum Technical Analysis: Key Levels to Watch
Looking at the 1D ETH/USDT chart, ETH has built a strong recovery since bottoming out between June and July. It broke out sharply from around $1,900 and now sits in a range near $2,400 to $2,520.
ETH is holding above its 20 EMA, which sits near $2,439. The 50, 100, and 200-day averages are all much lower, which still supports the bigger bullish picture.
Here's the setup in simple terms:
A daily close above $2,520 to $2,530 could open a path toward $2,650 to $2,750
A move past that zone could bring $2,850 to $3,000 into view
Losing $2,400 would weaken the setup and risk a drop to $2,300 to $2,265
Below $2,265, the bullish case gets much weaker
This is a technical read of the chart, not a guaranteed outcome.
Is Ethereum a Good Buy Right Now?
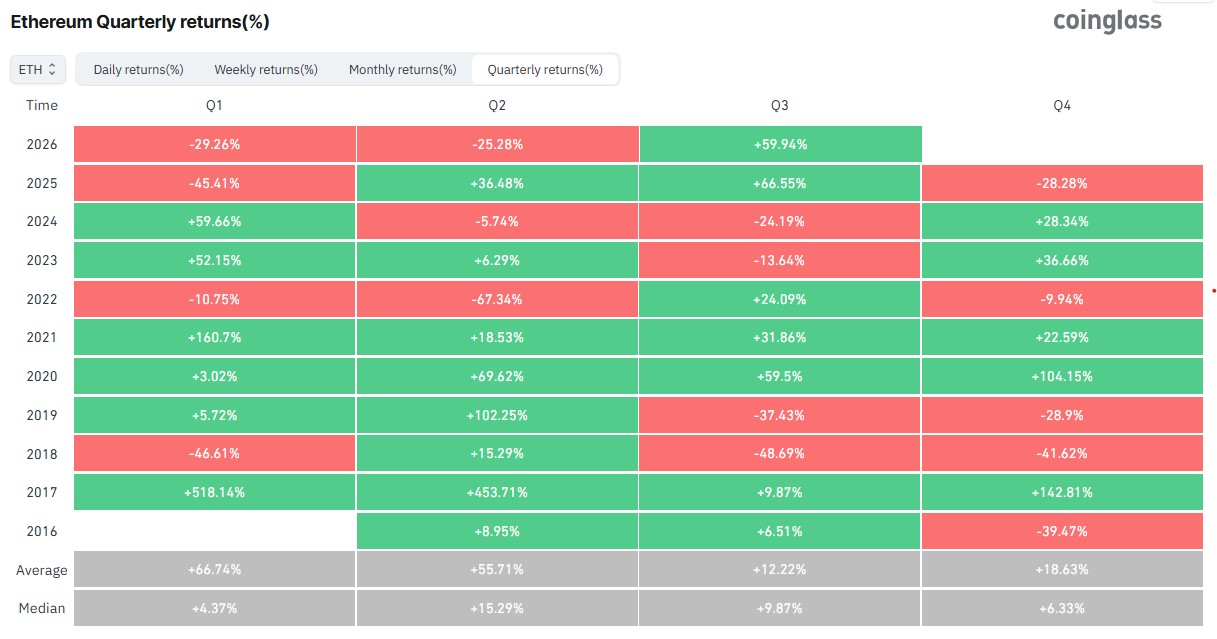
ETH has gained close to 60% this quarter, based on Coinglass return data. That follows two rough quarters earlier in the year, with Q1 down over 29% and Q2 down over 25%.
Historically, Q3 has been a decent quarter. The average return since 2016 sits at 12.22%, with a median of 9.87%. Some years were huge, like 2021's 31.86% gain, while others, like 2018's -48.69%, were brutal. A strong Q3 is not unusual, but it is not guaranteed every year either.
Year | Q3 Return |
2026 | +59.94% |
2025 | +66.55% |
2024 | -24.19% |
2023 | -13.64% |
2022 | +24.09% |
2021 | +31.86% |
2020 | +59.5% |
Average (2016-2025) | +12.22% |
Ethereum vs Bitcoin: Is ETH Breaking Out?
Some traders are watching the ETH/BTC chart closely. Crypto Rover pointed out that ETH against Bitcoin looks like it is breaking out of a downtrend lasting roughly five years, calling for the next two to three years to be strong for altcoins if the pattern holds.
That is one trader's read of the chart, not a confirmed reversal. Whether ETH keeps gaining ground on BTC depends a lot on how this week's Fed decision and broader risk appetite play out.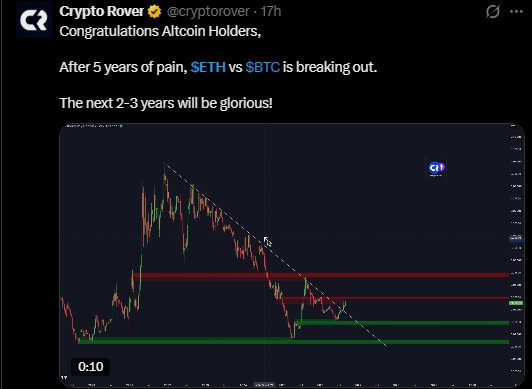
What Is the Triangle Pattern Traders Are Watching?
On the 12-hour chart, analyst Ali Charts flagged a repeating triangle pattern. The last time this triangle broke out, the price jumped 31% in three days, moving from around $1,900 toward higher levels.
At the time of that chart, ETH was marked near $2,474, sitting just under the triangle's resistance line. A second triangle has now formed. If it breaks out the same way, some traders think a move toward $3,000 is possible.
This is a repeat pattern read, not a confirmed setup. Triangles can also break down instead of up.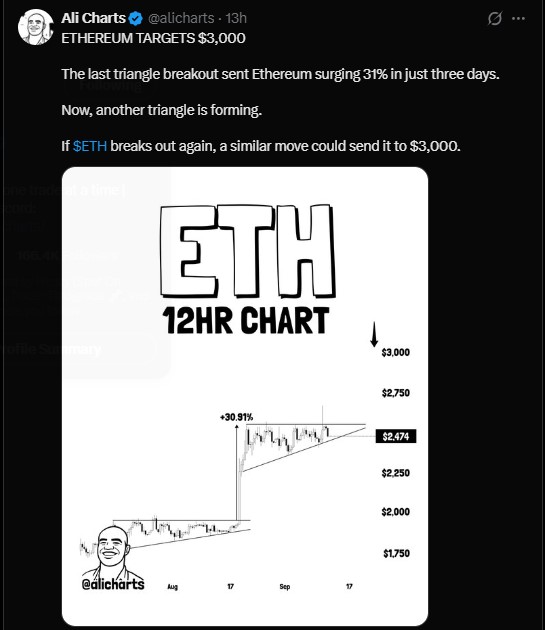
Ethereum Price Prediction: What Happens Next?
The next few days matter a lot for ETH price. Three catalysts land within four days of each other, and each carries real weight.
If the altcoin holds above $2,400 and pushes past $2,520 to $2,550, the path toward $2,700 and then $3,000 stays open. If it slips under $2,400, a retest of the $2,300 zone becomes more likely.
Markets have already priced in a lot of what's expected this week. The bigger swings, up or down, may come from whatever catches traders off guard.
Disclaimer
This article is for informational purposes only and does not constitute financial advice. Cryptocurrency markets are highly volatile and unpredictable. Prices mentioned reflect data available at the time of writing and may change rapidly. Always do your own research and consult a licensed financial advisor before making any investment decisions. Past performance and chart patterns do not guarantee future results.
0
0

 Manage all your crypto, NFT and DeFi from one place
Securely connect the portfolio you’re using to start.


