New Day, New Bitcoin All-Time High: What’s Next For BTC Price?

0
0

Bitcoin has once again hit a new all-time high, briefly moving above $121,000 before stabilizing near $120,500. The price is up 2.54% today, continuing a strong trend that started earlier this month. But is this rally sustainable, or nearing a slowdown?
Key indicators suggest the trend might not be done just yet.
Holders Aren’t Taking Profits Yet
The adjusted Spent Output Profit Ratio (aSOPR) currently sits at 1.03, well below the early July 2025 levels, where aggressive profit-taking pushed the ratio much higher. This time, despite Bitcoin making new highs, traders appear to be holding instead of selling.
 BTC price and adjusted SOPR: Glassnode
This means most coins being moved on-chain are not being sold for massive gains, which suggests the rally is not overheated.
SOPR shows whether BTC moved on-chain is being sold at a profit (>1) or at a loss (<1). Adjusted SOPR fine-tunes the metric and filters out short-term internal transactions to show whether BTC moved on-chain is being sold at a profit or loss.
Volume is Supporting the Rally
On-Balance Volume (OBV) is moving up in tandem with Bitcoin’s price, a key sign that buying volume is keeping pace with the rally. There’s no visible divergence, no breakdown in momentum.
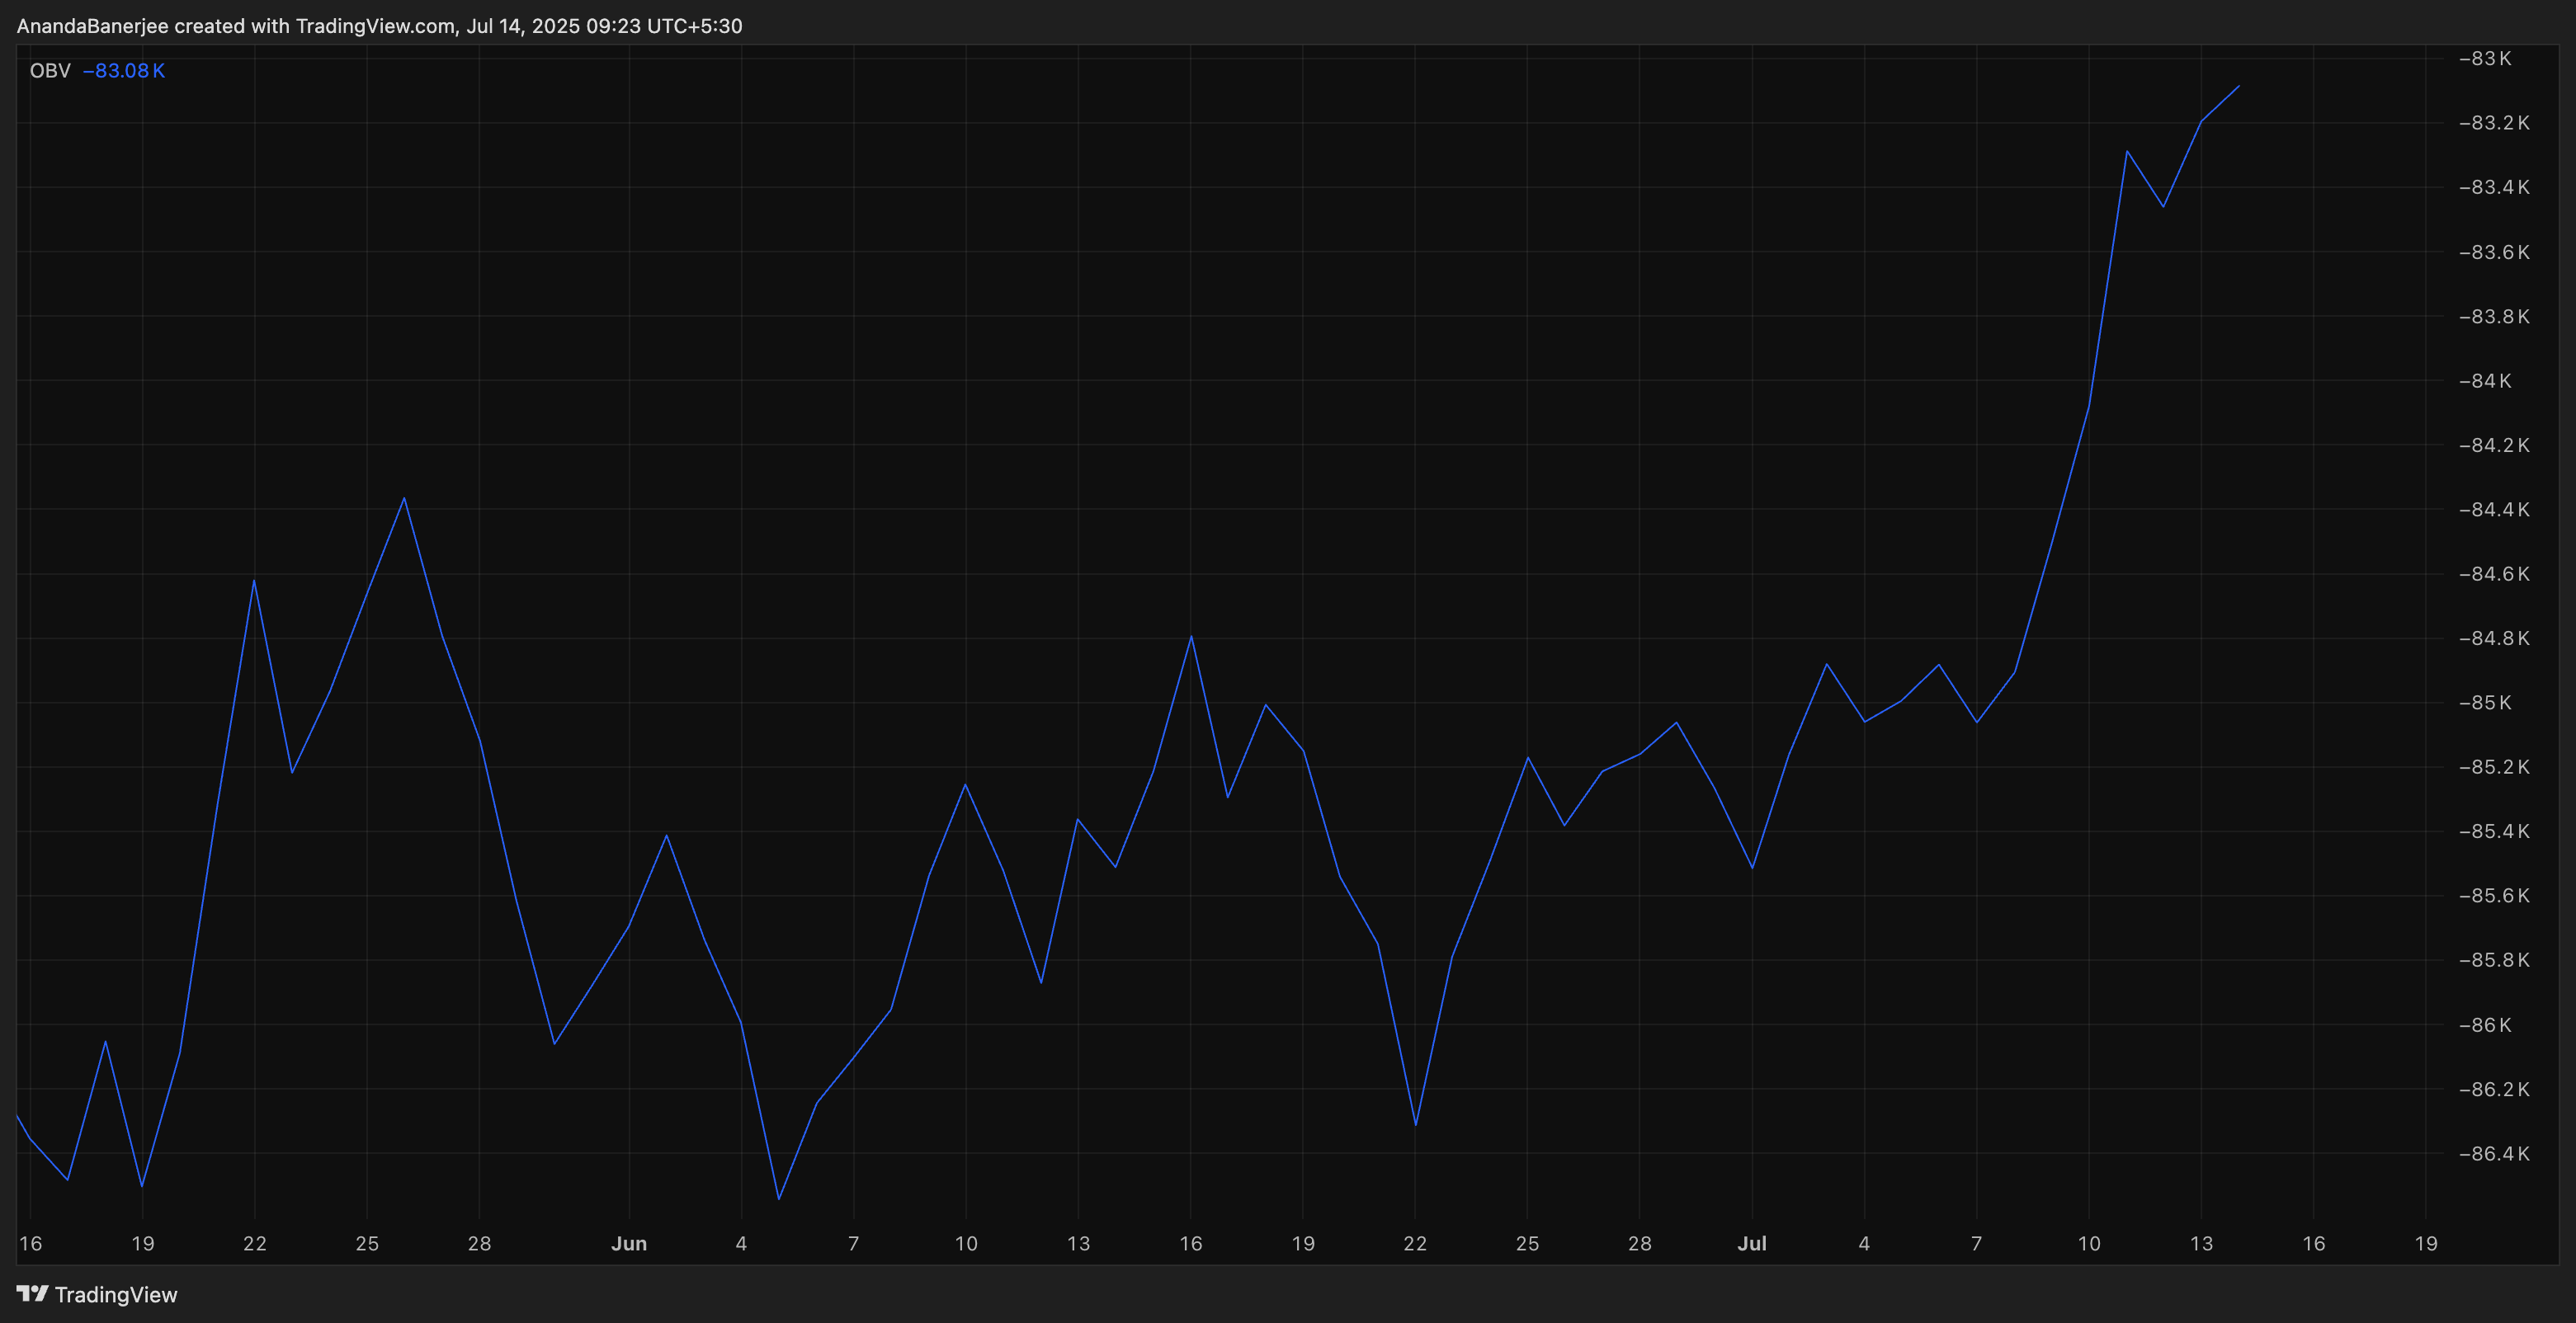 Bitcoin price supported by volume (OBV chart): TradingView
In simpler terms: BTC is going up, and the volume is going with it, not against it.
OBV measures cumulative buy/sell pressure based on daily volume direction. It is a bullish sign when it follows a positive price trend.
BTC Price Structure and Next Levels
BTC is currently holding just below $121,519, a key resistance level from the Trend-Based Fibonacci Extension. If Bitcoin closes above this level, the next extension target is $127,798, followed by $135,425. These are long-range projections based on previous trend behavior.
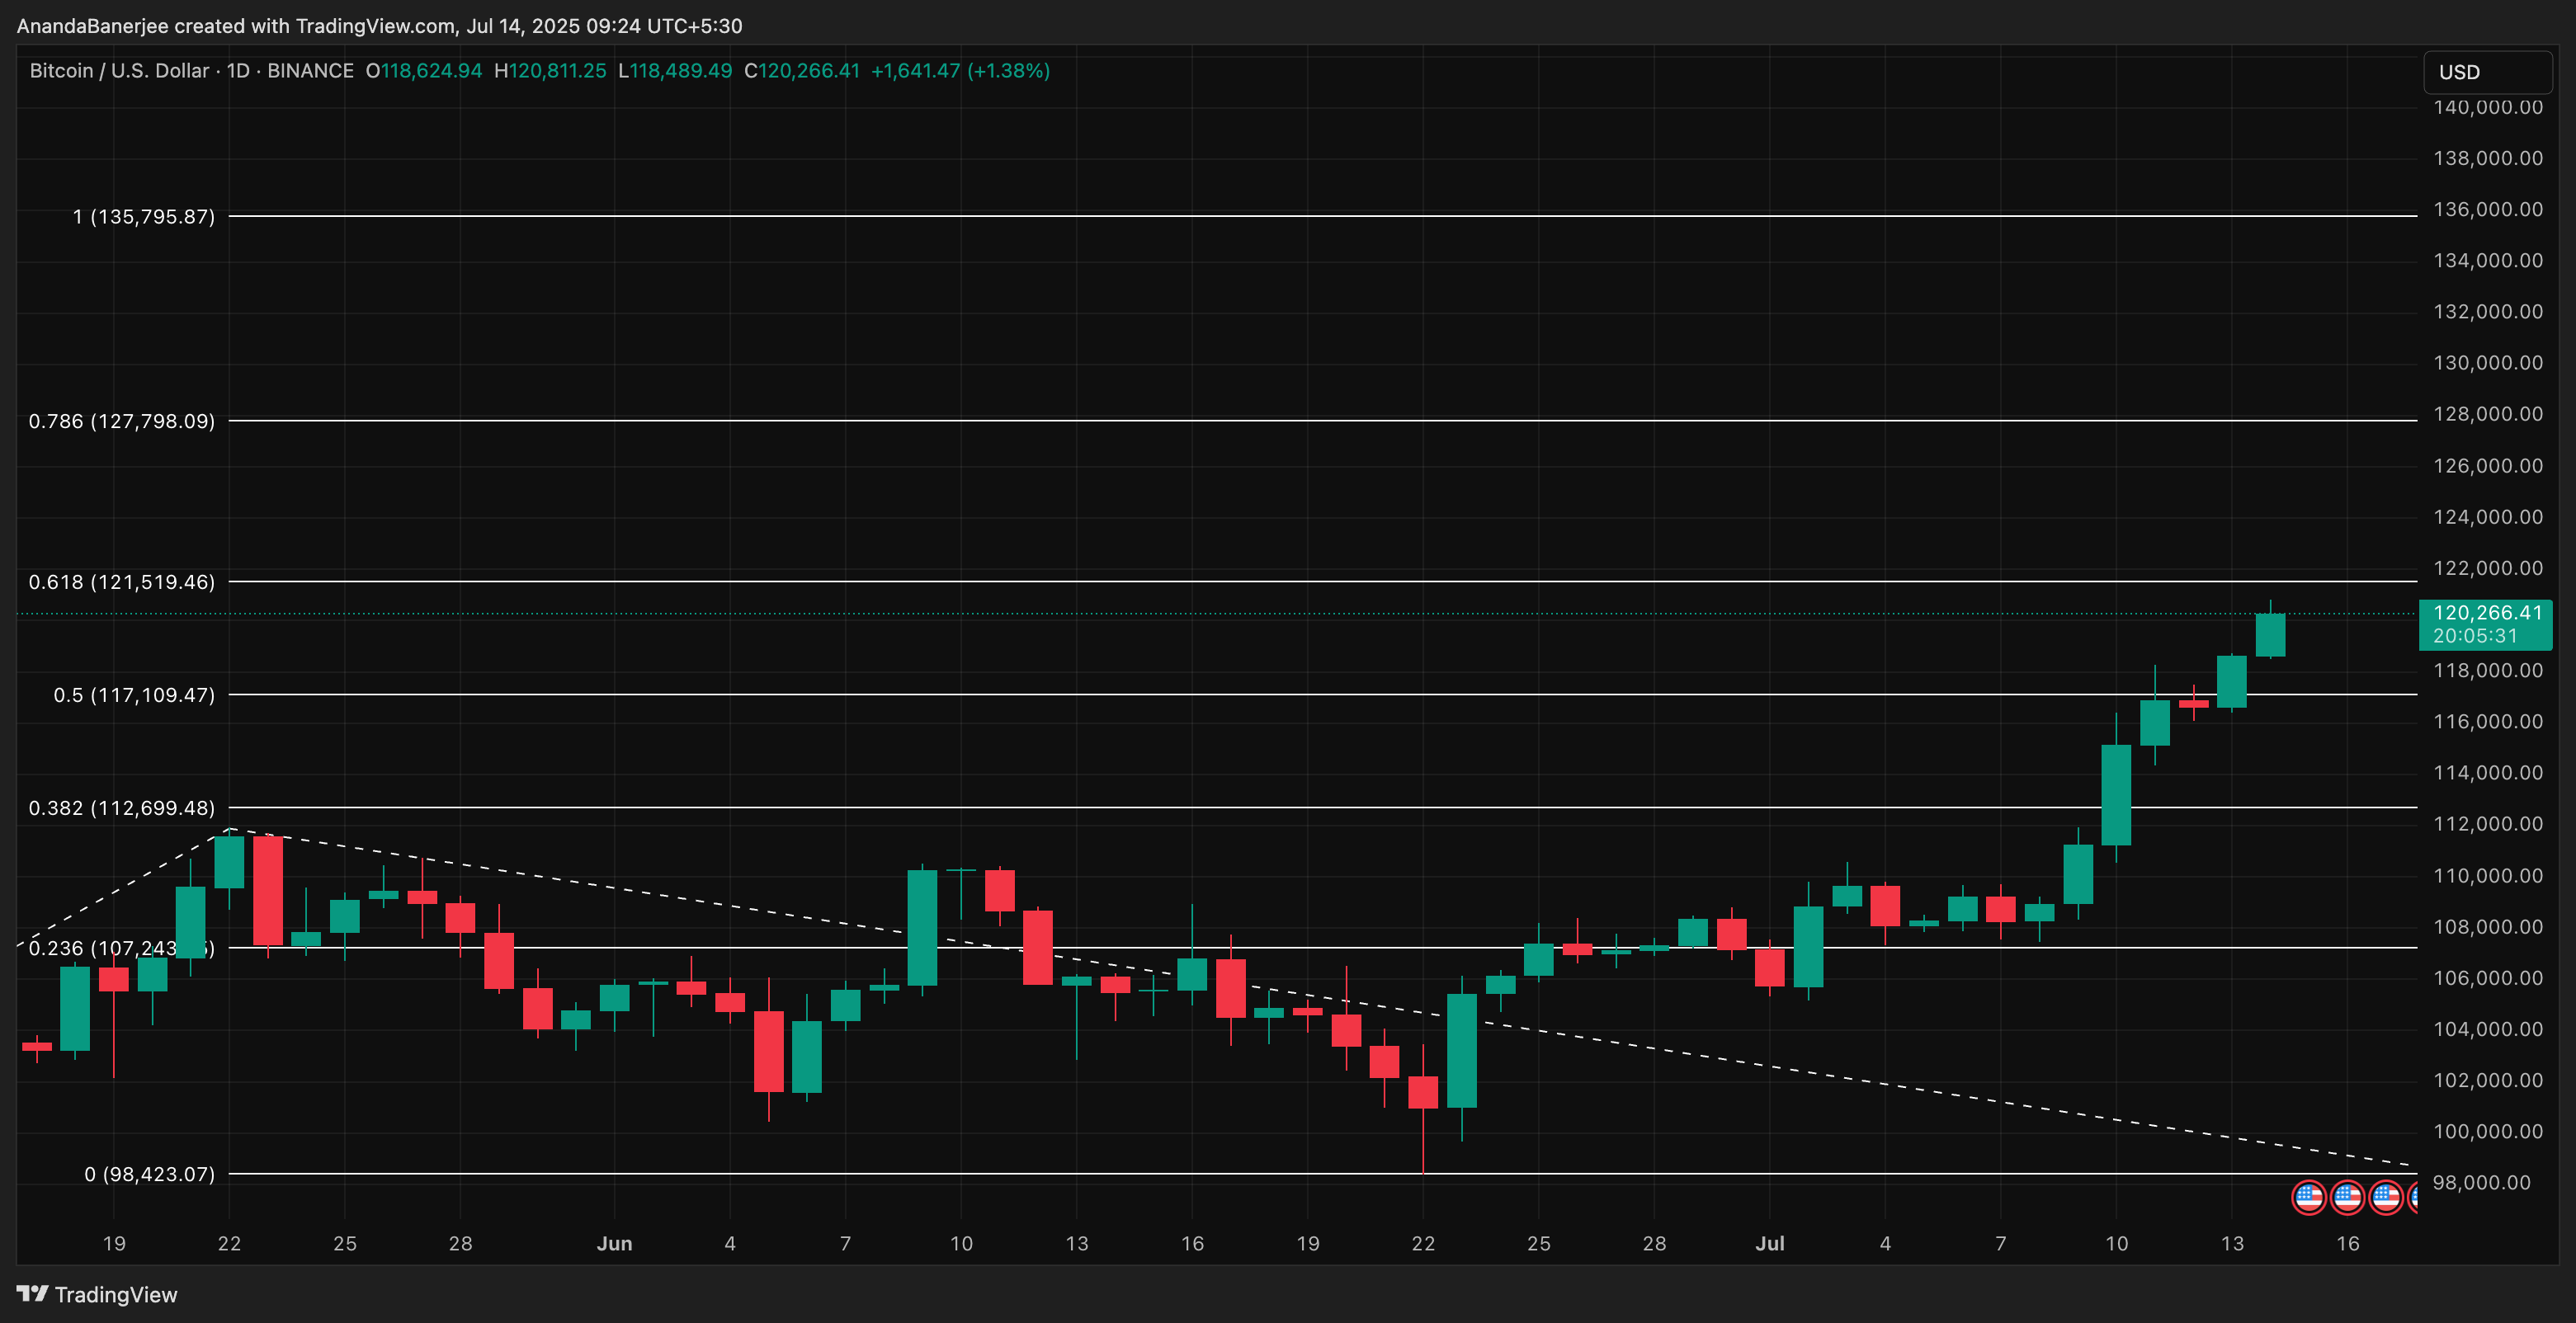 BTC price analysis: TradingView
Trend-Based Fibonacci Extension is a tool that uses three key price points: a low, a high, and a retracement, to project future resistance levels in a trending market.
If BTC consolidates, near-term support sits at; $117,109, which is a prior breakout area. The bullish trend would weaken if BTC falls below $112,699, a key support level near the first all-time high, especially if exchange inflows spike or SOPR starts to rise sharply. That would suggest holders are starting to take profits aggressively, which could lead to a pullback or trend reversal.
0
0


 Manage all your crypto, NFT and DeFi from one place
Securely connect the portfolio you’re using to start.


0
0

0
0

0
0