Why Is The Crypto Market Up Today?

0
0

The total crypto market cap bounced 1.63% on March 30, recovering to 2.30 trillion after Sunday’s sharp flush to the 2.25 trillion floor. Bitcoin led the recovery, dragging governance token DeXe (DEXE) up 14.06% to $8.169.
The move puts DEXE directly at a Fibonacci decision point. How Bitcoin closes this daily candle determines whether the rally continues or stalls at the first meaningful wall.
In the news today:-
- Strategy appears to have broken its 13-week Bitcoin buying streak after Executive Chair Michael Saylor skipped his usual Sunday “Orange Dot” tracker post, instead promoting the company’s preferred stock. A Monday 8-K filing will confirm whether the pause was real or whether a quiet purchase was made without the customary announcement.
- Iran’s Parliament Speaker Mohammad Bagher Ghalibaf posted on X urging followers to trade against Trump’s pre-market energy announcements, calling them a reliable “reverse indicator.” The comment underscored a broader collapse of Wall Street’s dip-buying instinct as genuine geopolitical risk made contrarian plays increasingly unpredictable.
The Crypto Market Shows Recovery
The total crypto market cap closed March 30 at $2.3 trillion, up 1.63% on the day, recovering from the March 29 low that dipped down toward the $2.25 trillion support. The current candle is building above that level, suggesting demand is stepping in.
A hold above $2.25 trillion opens a move toward the $2.32 trillion resistance, and reclaiming that level would confirm bulls are back in control. The $2.37 trillion level is the next meaningful target after that.
Want more token insights like this? Sign up for Editor Harsh Notariya’s Daily Crypto Newsletter here.
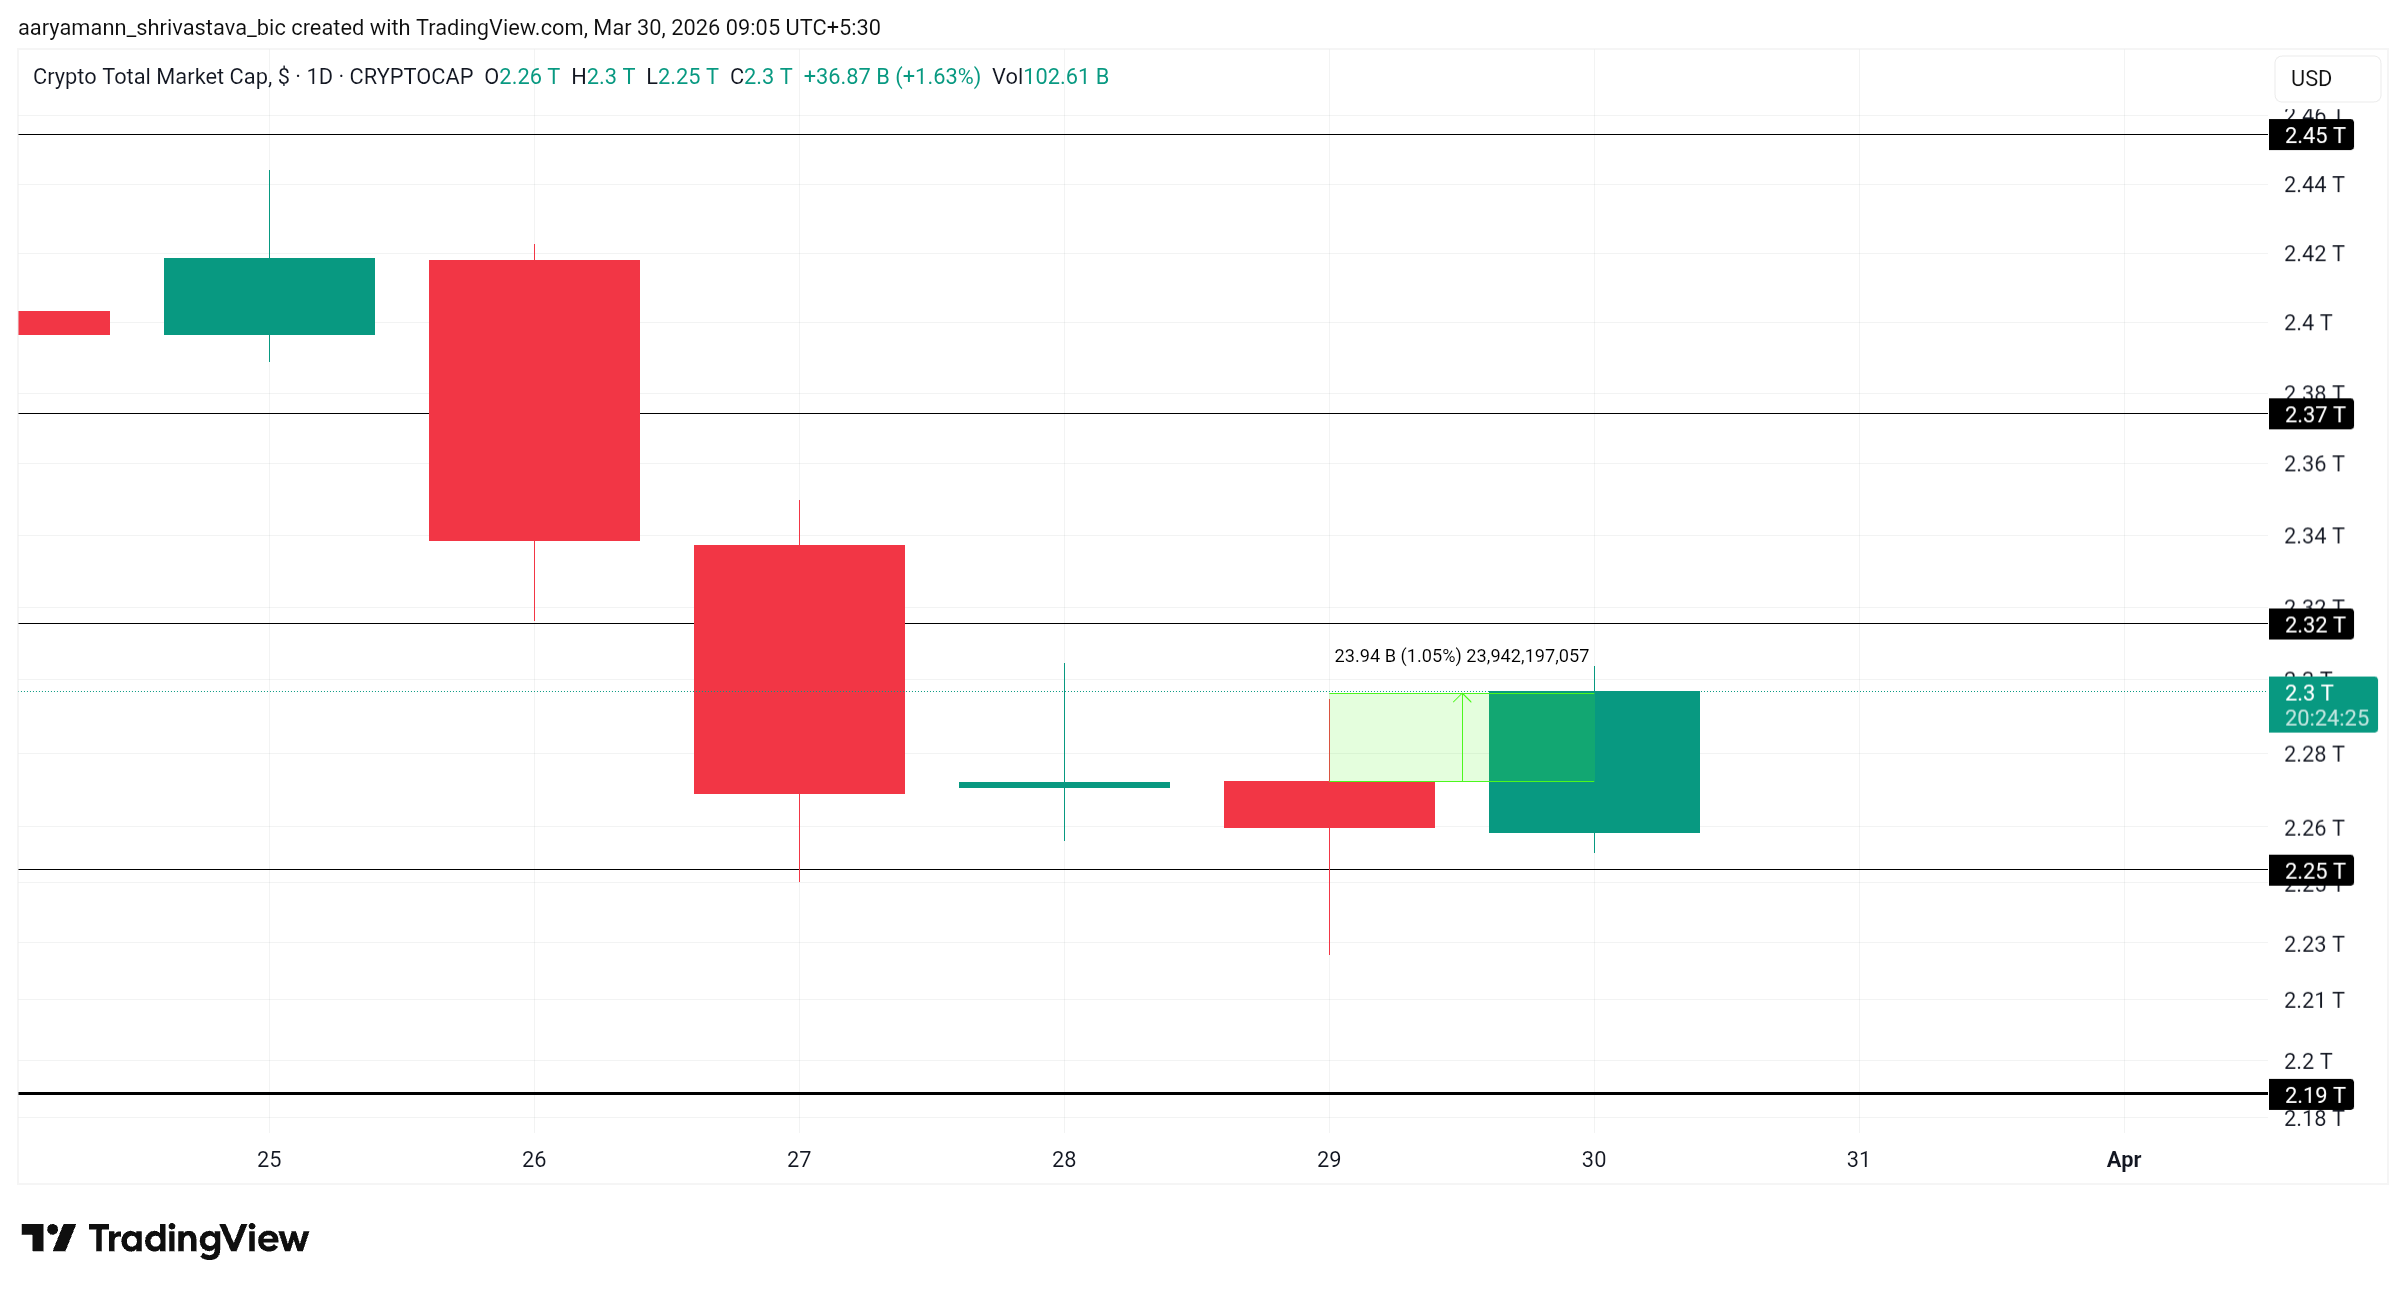 TOTAL Crypto Market Cap Analysis. Source: TradingView
If the daily candle closes below $2.25 trillion, the recovery thesis weakens. A sustained break lower exposes $2.19 trillion, which is the lower boundary visible on the chart.
Bitcoin Breaks Back Above Trendline After Sunday’s Reversal
Bitcoin is trading at $67,216, up 1.83% on the day, sitting below the $68,830 resistance after breaking below the ascending trendline support from late February. Price has been ranging between $65,887 and $68,830 for several sessions, compressing into a decision zone.
A reclaim of $68,830 on a daily close would shift momentum back to bulls, targeting $70,000 and then $72,294. The rising trendline, currently near the $67,000 zone, may provide near-term dynamic support.
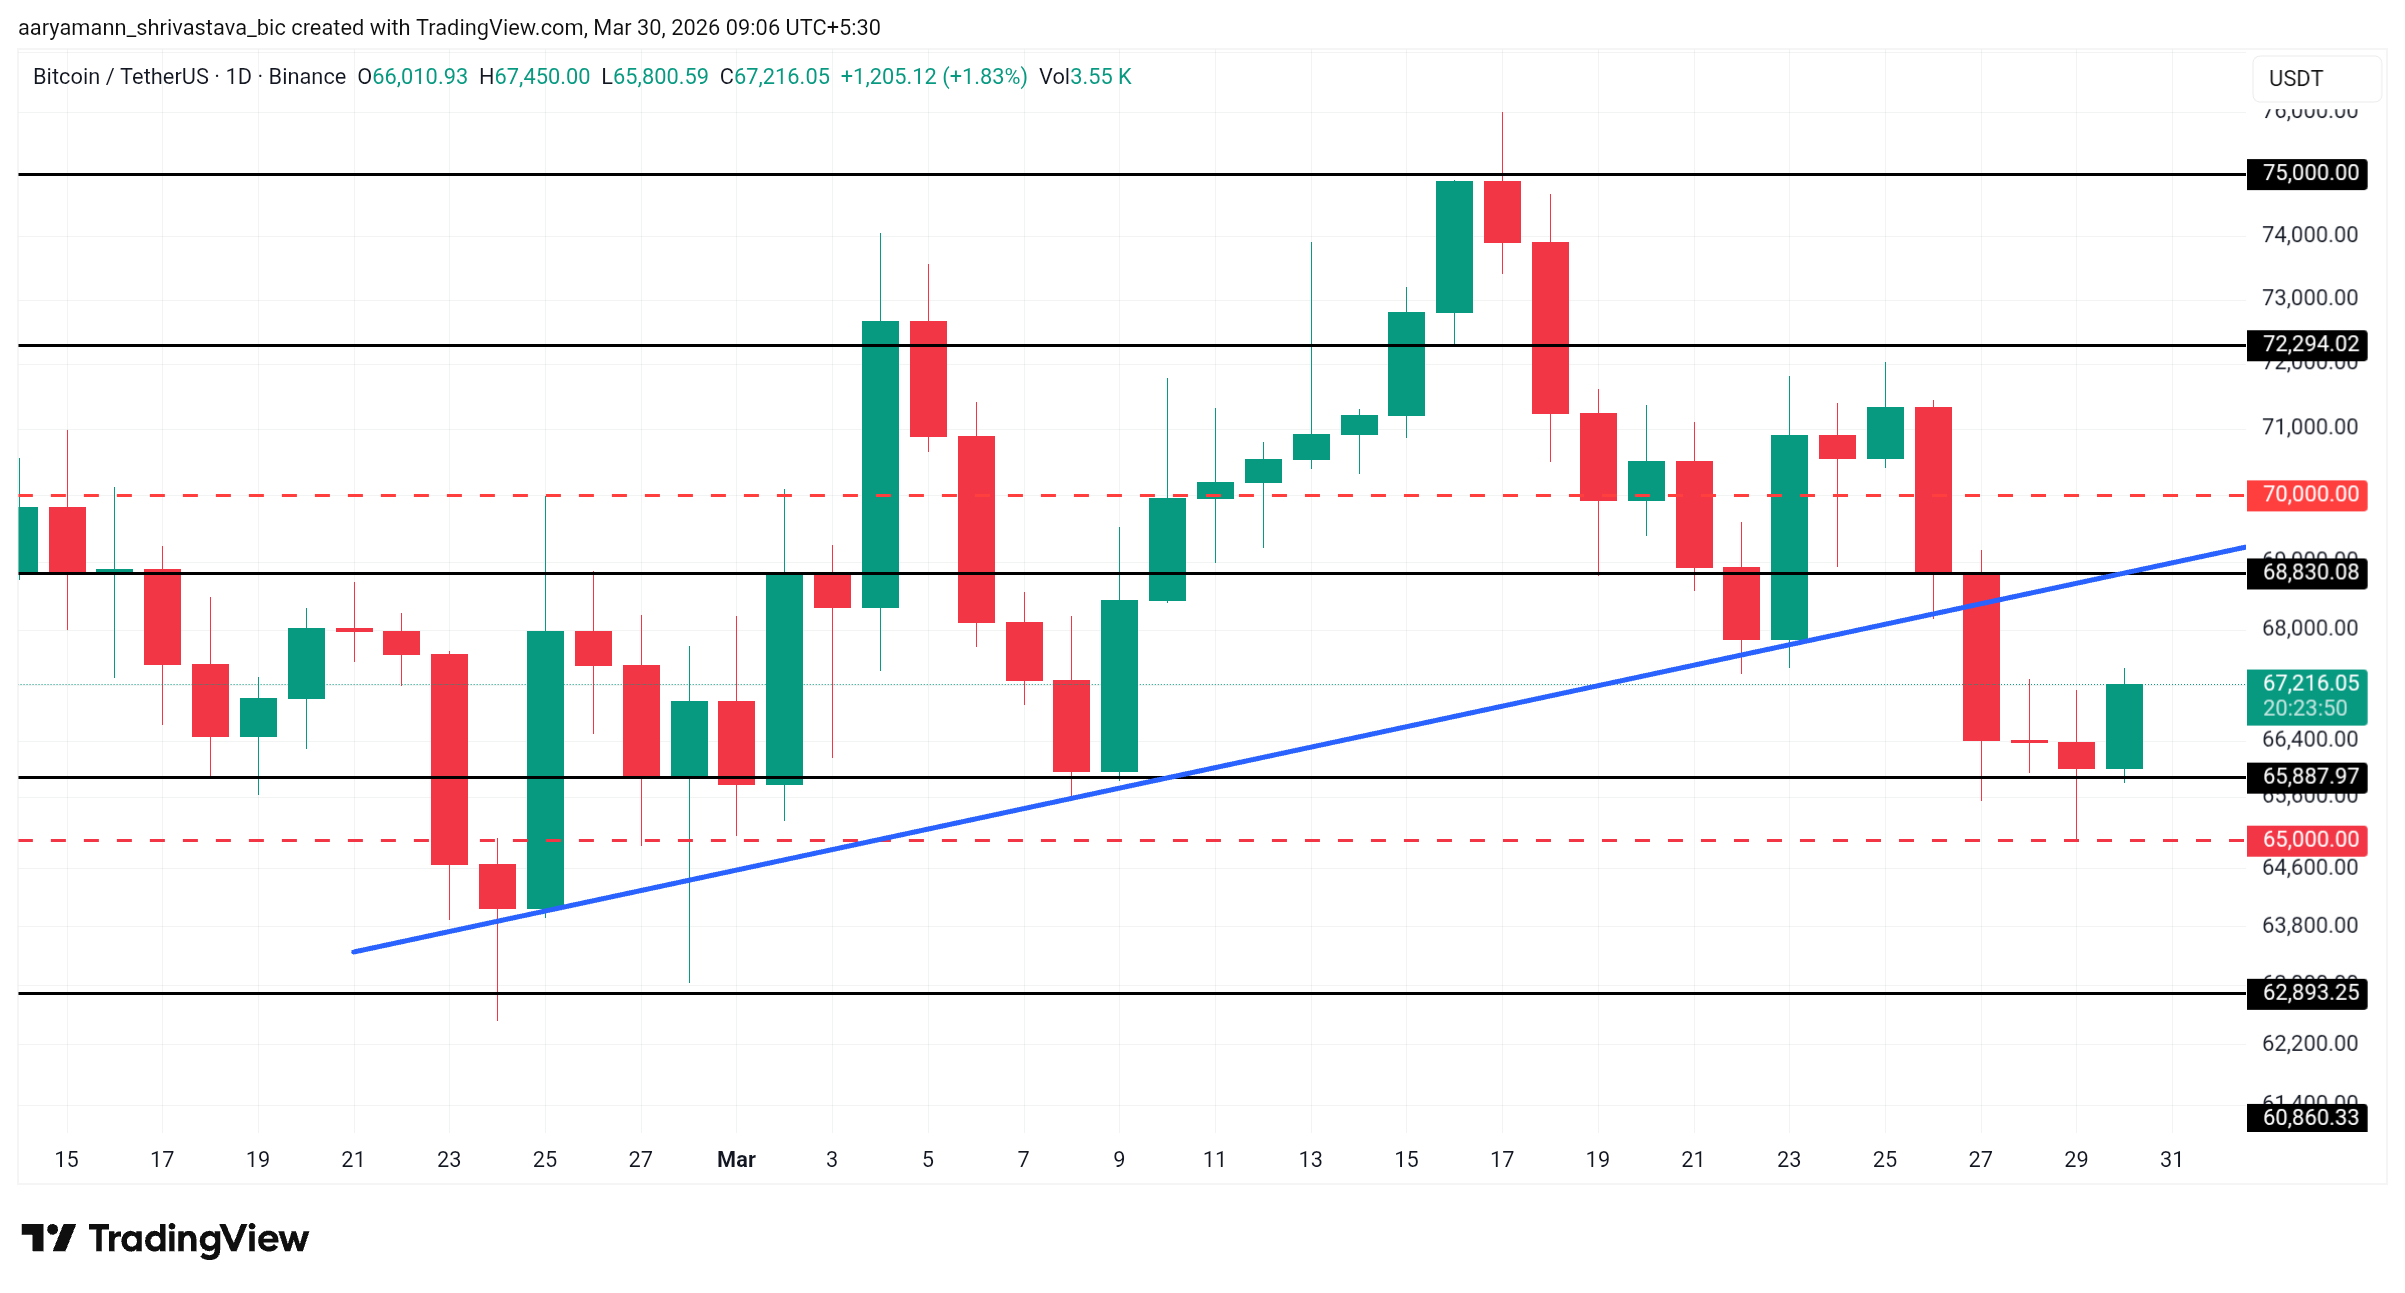 Bitcoin Price Analysis. Source: TradingView
A daily close below $65,887 invalidates Bitcoin’s recovery setup and brings $62,893 into scope as the next major structural support.
Dexe Notes a Jump
DeXe is trading at $8.169, up 14.06% on the day, closing above the 0.382 Fibonacci retracement at $8.208. The daily candle is testing this level as the price attempts to establish it as new support after a strong push from the $6.764 base.
The 0.618 Fibonacci level at $9.100 is the immediate target if $8.208 holds. Above that, the 1.0 extension at $10.544 becomes the measured upside objective, representing the full retracement recovery.
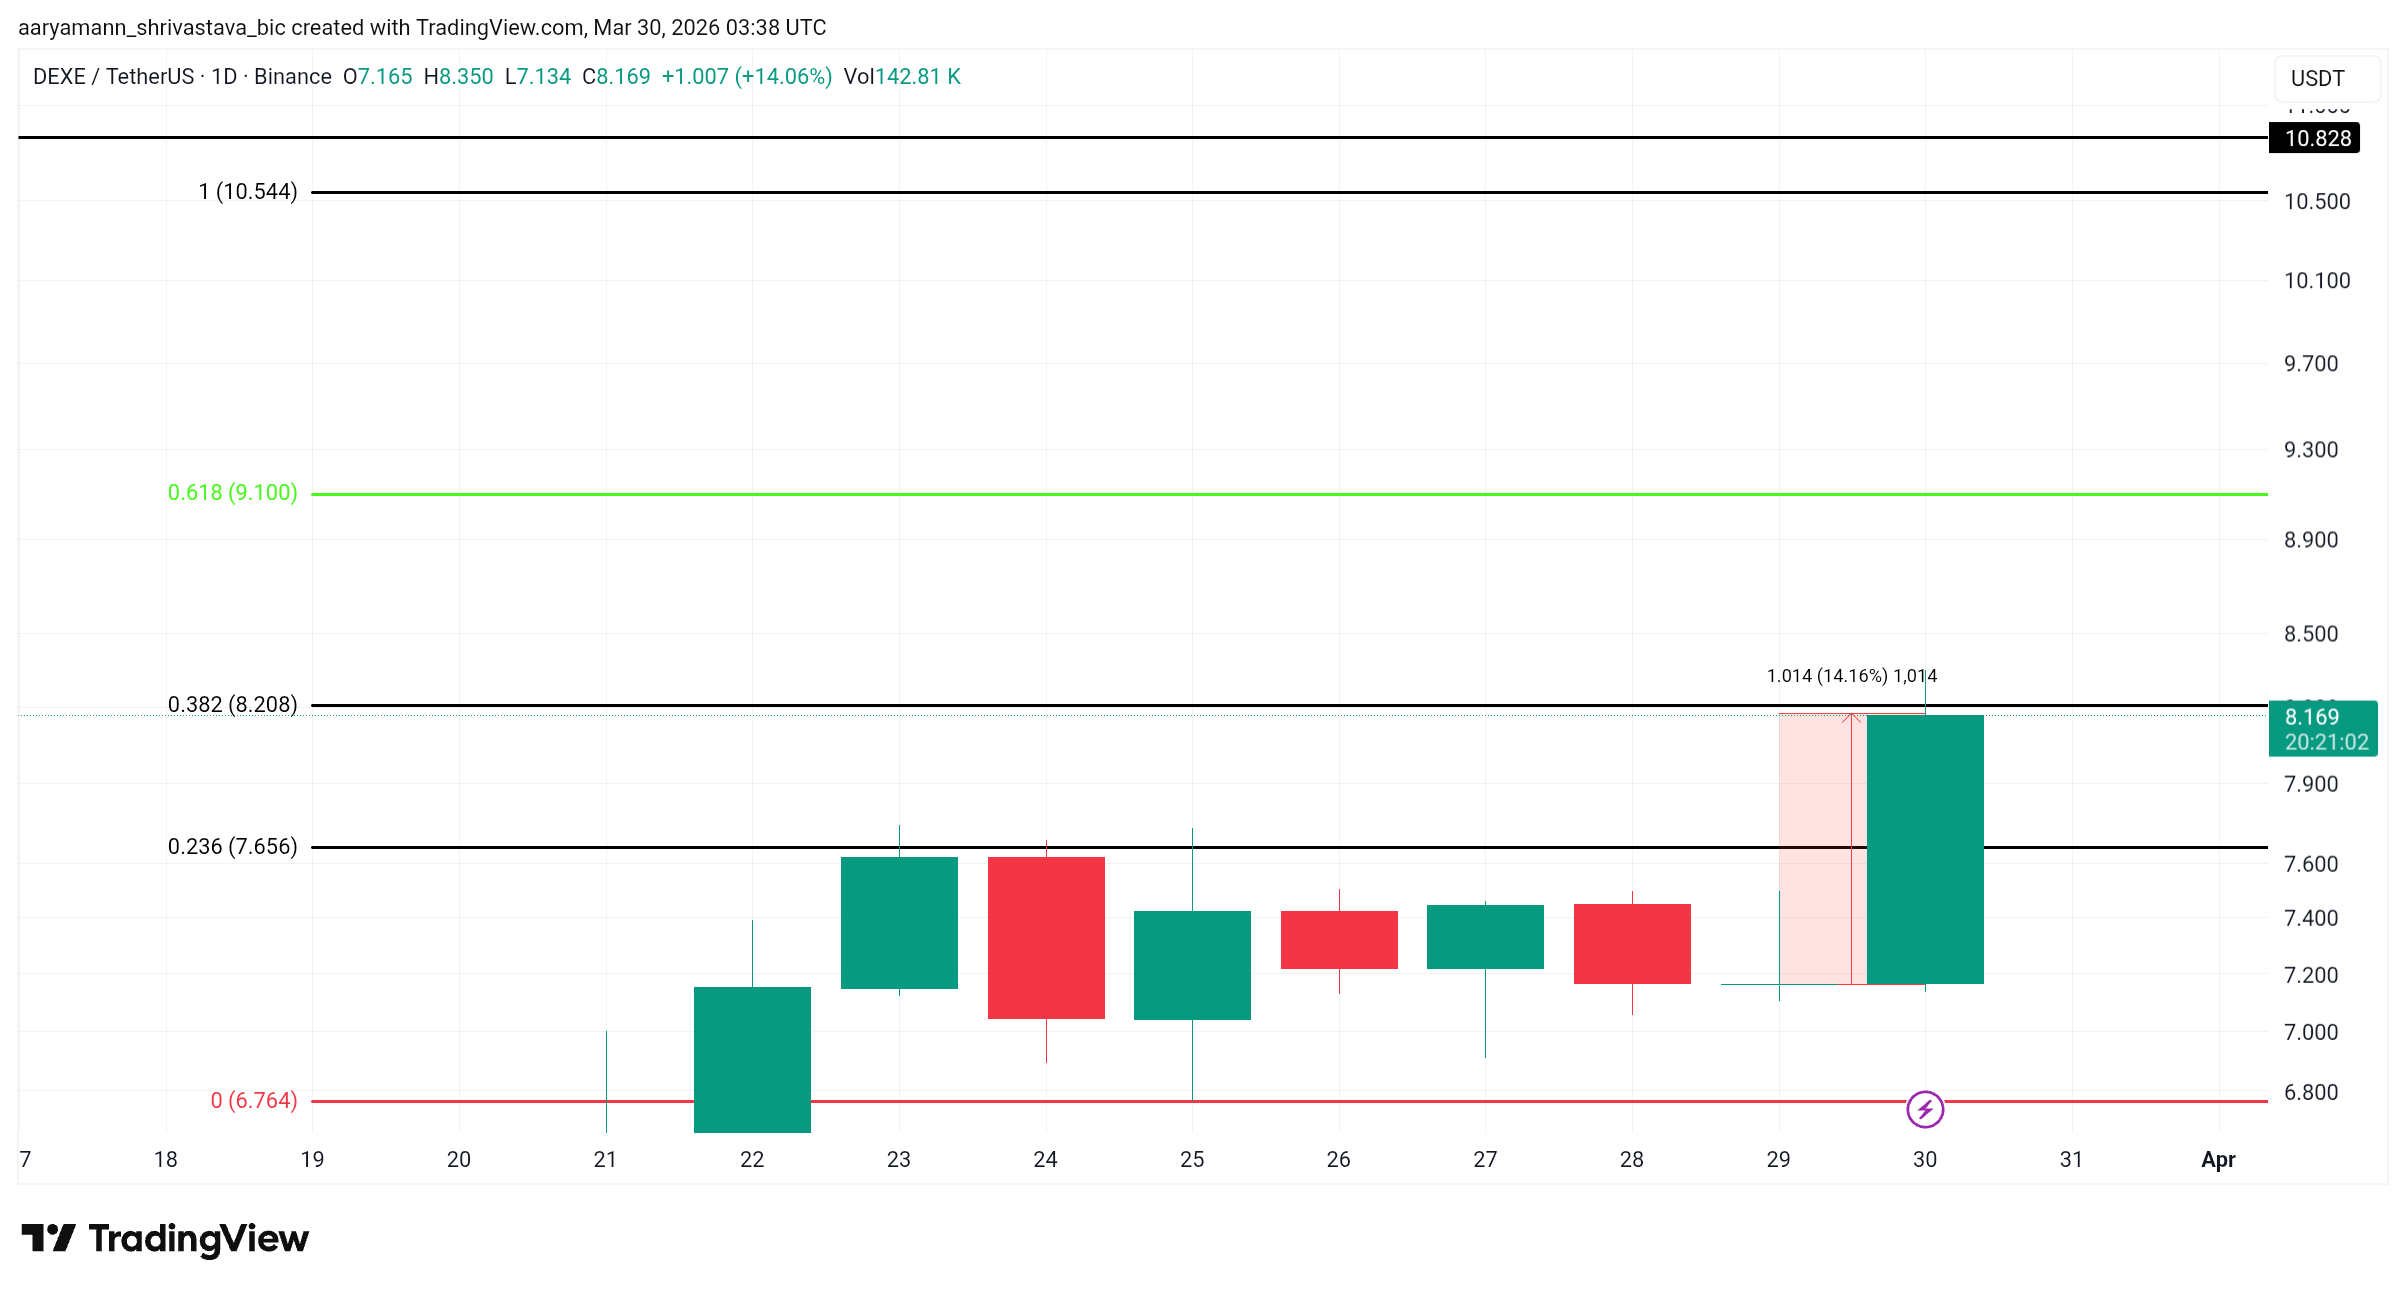 DEXE Coin Price Analysis. Source: TradingView
Failure to hold $8.208 on a daily close sends DEXE back toward the 0.236 level at $7.656. A breakdown below $6.764 would fully invalidate the current bullish structure.
0
0


 Manage all your crypto, NFT and DeFi from one place
Securely connect the portfolio you’re using to start.


0
0