
Hyperliquid Price Prediction: $HYPE Could Skyrocket If $60 Breaks

0
0

Hyperliquid launched as a decentralized perpetuals exchange built on its own dedicated blockchain, aiming to give traders the speed of a centralized platform without giving up self-custody.
It grew fast on the back of that pitch, pulling in serious trading volume and a token that quickly climbed into the top tier by market cap.
Hyperliquid is currently trading at $56.59, down 0.8% over the last 24 hours, after moving between $56.33 and $58.40 during the session.
Live Market Data
Before getting into where this Hyperliquid price prediction leans, here's the current market snapshot for HYPE, straight from live data rather than a stale cache.
| Metric | Value |
|---|---|
| Price | $56.59 |
| 24h Change | -0.8% |
| 24h Range | $56.33 – $58.40 |
| Market Cap | $12.592B |
| Fully Diluted Valuation | $56.596B |
| 24h Volume | $268.271M |
| TVL | $6.186B |
| Circulating Supply | 222.446M HYPE |
| Total Supply | 955.307M HYPE |
| Max Supply | 1B HYPE |
| Total Treasury Holding | 19,724,727 HYPE |
Source: $HYPE market cap data taken from Coingecko, data as of Aug 14, 2026. Figures may vary slightly across other tracking websites.
$HYPE Liquidation Snapshot
Liquidation data over the past 24 hours actually favors shorts getting caught out, with $824.95K in total liquidations and $566.64K of that coming from short positions against $258.31K in longs, likely tied to an earlier push higher. That picture flips on shorter windows, though. 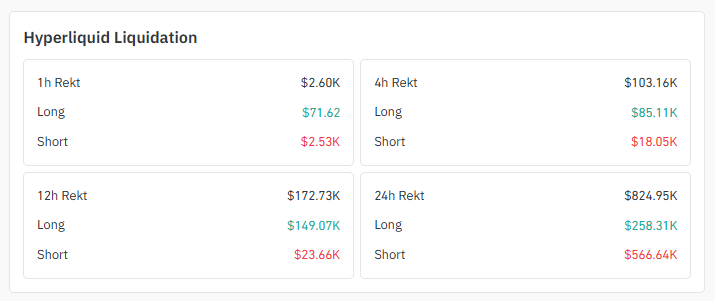
Source: Liquidation Data Taken From TradingView.
The 4-hour window shows $85.11K in long liquidations against just $18.05K in shorts, and the 12-hour window is similarly long-heavy at $149.07K versus $23.66K.
That shift suggests momentum has turned since the shorts got squeezed, with longs now absorbing the more recent pressure.
$HYPE Exchange Volume
HYPE's 24-hour trading volume totals $268.271M, with Binance leading at $330.23M in the broader heatmap read, followed closely by LBank at $242.87M and MEXC at $231.79M. 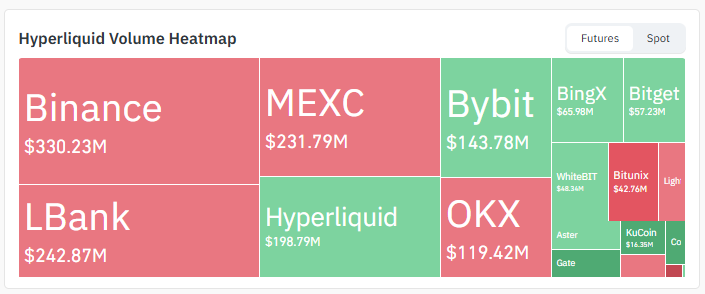
Source: Volume Heatmap Data Taken From TradingView.
Hyperliquid's own venue contributes $198.79M, with Bybit and OKX adding $143.78M and $119.42M, respectively. The rest spreads across BingX, Bitget, WhiteBIT, Bitunix, and KuCoin in smaller amounts.
Volume being this spread out across major venues for Hyperliquid, including its native exchange, points to genuinely broad participation rather than activity concentrated in one corner of the market.
Key Takeaways
-
Hyperliquid is trading at $56.59, down 0.8% over the last 24 hours
-
4H chart shows HYPE testing the lower boundary of an ascending channel right now
-
1D chart shows HYPE squeezed into a symmetrical triangle nearing its apex
-
24h liquidations hit $824.95K, mostly from shorts ($566.64K), but recent hours flipped long-heavy
-
Binance leads volume at $330.23M, with Hyperliquid's own exchange contributing $198.79M.
Technical Analysis for Hyperliquid Price Prediction
4-Hour Chart Analysis
The 4H chart has $HYPE inside an ascending channel, and the price is heading straight into the lower boundary of that channel as it stands. 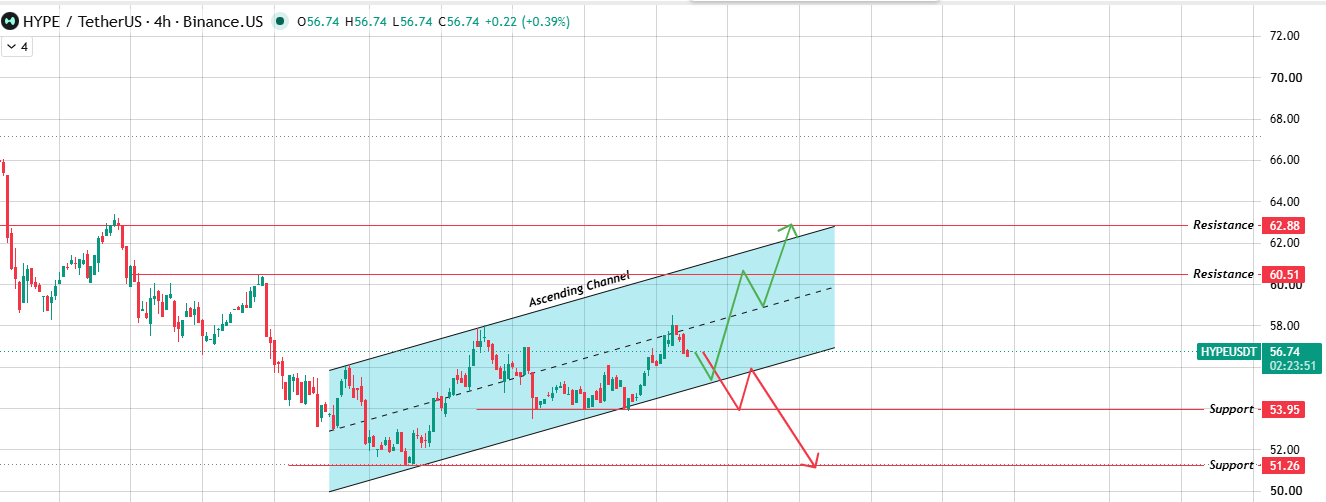
Source: Chart Taken From TradingView .
A bounce from here with volume behind it would put the first resistance at $60.51 in range for this Hyperliquid price prediction, and clearing that opens the door to $62.88 beyond it.
If instead the lower boundary breaks, the channel structure fails, and $HYPE likely slides toward $53.95 first, with $51.26 as a deeper floor if selling continues.
This lower boundary test is really the whole ballgame for the short-term trend right now.
Daily Chart Analysis
The daily chart tells a different story, with $HYPE compressed inside a symmetrical triangle where the highs keep coming in lower and the lows keep coming in higher, squeezing price toward the apex near current levels. 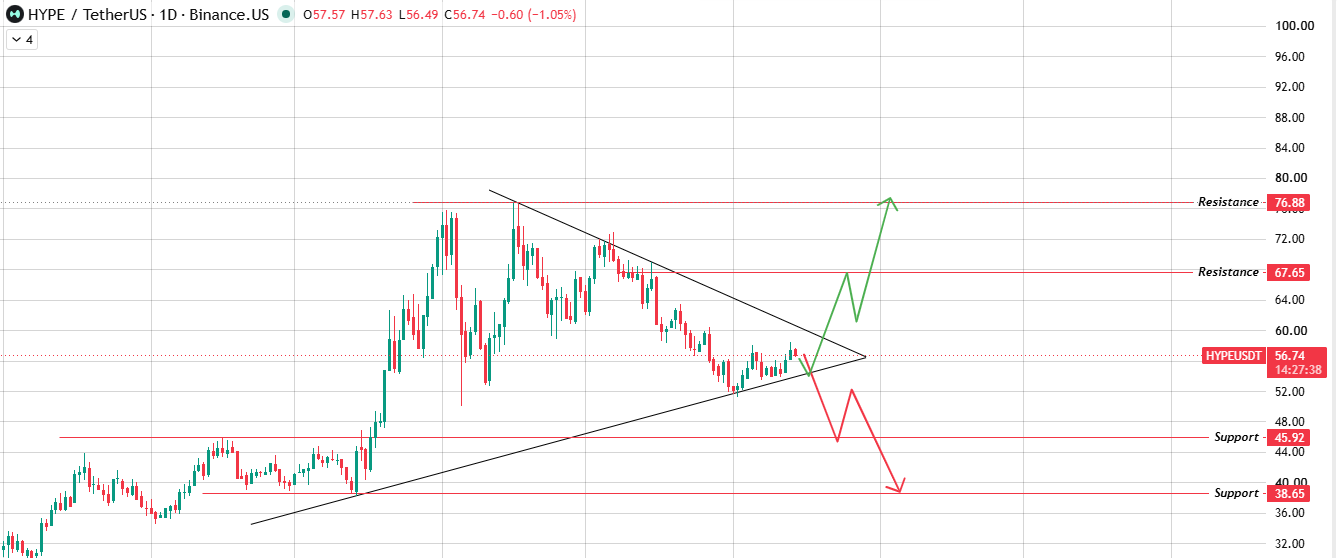
Source: Chart Taken From TradingView.
A volume-backed break above the triangle level of $67.65 first, with $76.88 further out if momentum actually carries through.
A breakdown instead points toward $45.92, and a failure there opens up $38.65 as the next real support.
Triangles like this tend to resolve with a sharper move than usual once one side finally gives, simply because the range has been tightening for so long.
Hyperliquid Support & Resistance Levels
| Timeframe | Support 1 | Support 2 | Resistance 1 | Resistance 2 |
|---|---|---|---|---|
| 4H | $53.95 | $51.26 | $60.51 | $62.88 |
| 1D | $45.92 | $38.65 | $67.65 | $76.88 |
Bull, Base, Bear Case
This Hyperliquid price prediction comes down to a test that's happening right now, since price is sitting right at the lower boundary of the 4H channel while the 1D chart squeezes into a much tighter decision zone above it.
Both timeframes are essentially asking the same question from different angles.
| Scenario | Price Level | Conditions | Invalidation |
|---|---|---|---|
| Bull Case | $60.51 – $76.88 | Bounce from 4H channel support and volume-backed break above the 1D triangle | Rejection at $60.51 and close back below the 4H channel support |
| Base Case | $53.95 – $60.51 | Price holds inside the 4H channel while the 1D triangle keeps compressing | Close outside either the channel or triangle boundaries |
| Bear Case | $51.26 – $38.65 | Break of 4H channel support, followed by a breakdown of the 1D triangle | Reclaim of $53.95 with strong volume |
Glossary
Ascending Channel: a price structure where each low sits a little higher than the last, boxed in by two rising parallel lines.
Symmetrical Triangle: a pattern where falling highs and rising lows converge toward a single point, squeezing price into a shrinking range.
Resistance Level: a price zone where selling pressure has historically stepped in and stalled upward moves.
Support Zone: a price area where buyers have repeatedly stepped in to catch falling prices.
Liquidation: the forced closure of a leveraged position when losses eat through the trader's margin.
Methodology
This prediction was built from multi-timeframe chart analysis (4H and 1D) submitted for review, cross-checked against live market data, exchange volume distribution, and liquidation figures. No price levels were extrapolated beyond what appeared in the source charts.
Disclaimer: This article is for informational purposes only and does not constitute financial advice. Cryptocurrency markets are highly volatile, and past chart patterns don't guarantee future outcomes. Always do your own research and consult a licensed financial advisor before making investment decisions.
0
0

 Manage all your crypto, NFT and DeFi from one place
Securely connect the portfolio you’re using to start.

0
0


0
0