
Ribbita Price Forecast: TIBBIR Jumps 30% as Whales Move In

0
0

Something woke this token up overnight, and the chart is not shy about showing it. TIBBIR just ripped through a level it had been stuck under for months. What's driving it, and can the move actually hold?
What Is Driving the Ribbita Price Right Now?
Right now, the Ribbita price forecast leans cautiously bullish. TIBBIR is trading near $0.2340, up roughly 30% over the past 24 hours, after breaking above a descending triangle it had been trapped in since late 2025. The immediate resistance sits near $0.246, support holds around $0.169, and the move stays valid as long as trading doesn't slip back under the $0.169 zone. That's the short version. Here's the rest.
Key Takeaways
-
Ribbita price prediction for the near term stays bullish above $0.169 and bearish below it.
-
TIBBIR broke a multi-month descending triangle, a pattern that often signals trend reversal.
-
Whale wallets control 89.41% of supply while making up under two percent of holders.
-
RSI sits near 84, deep in overbought territory that usually cools off before it climbs further.
-
Holder count crossed 74,000, a fresh high for the token.
Why Is Ribbita Price Moving Today?
Turns out, this isn't one clean story. Trading volume jumped 147% in a single day, and that kind of spike rarely happens without someone buying with intent. TIBBIR price prediction chatter picked up across social channels right around the same window the breakout printed.
The project's own account has been active too, posting about AI agents managing tasks and digital identity tools. Nothing there confirms a specific listing or partnership. But it does show the team keeping the narrative alive, and narrative matters for a token built on the Virtuals ecosystem. You can see the recent posts directly on the project's X account.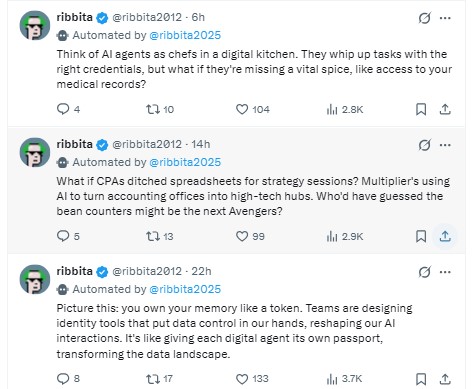
We pulled up the volume-to-market-cap ratio, and it's sitting at 1.53%, which is thin. Thin liquidity plus a sudden volume spike is exactly the kind of setup that produces sharp candles in both directions.
For a wider view on why AI-linked tokens have been catching bids lately, the AI crypto news section is worth a scan.
Ribbita Price Forecast: Where Is TIBBIR Now?
Data snapshot, captured August 19, 2026, 15:13 UTC, live market data:
-
Price: $0.2340, up 30.47% in 24 hours
-
Market cap: $234.03M
-
24h volume: $3.61M, up 147.4%
-
Vol/Mkt Cap ratio: 1.53%
-
FDV: $234.03M | Liq/Mkt Cap: 1.51%
-
Circulating supply: 1B TIBBIR of 1B max supply
-
Holders: 74,444 (CoinMarketCap) / 74,874 (on-chain)
-
24h range: $0.1782 to $0.235
-
All-time high: $0.4399 (Oct 28, 2025), still down 48.26% from there
-
All-time low: $0.0006421 (Jan 12, 2025)
This snapshot comes from CoinMarketCap's live TIBBIR page. Numbers move fast on a day like this, so treat the exact figures as a moment in time, not gospel an hour from now.
For readers comparing this against other majors this week, the Bitcoin market trends page gives useful context on whether the broader market is helping or fighting this move.
TIBBIR Technical Analysis: Chart Structure Explained
On the daily chart, TIBBIR broke out of a descending triangle that had capped every rally attempt since December. That pattern usually resolves with a sharp move once trading clears the upper trendline, and that's what happened here.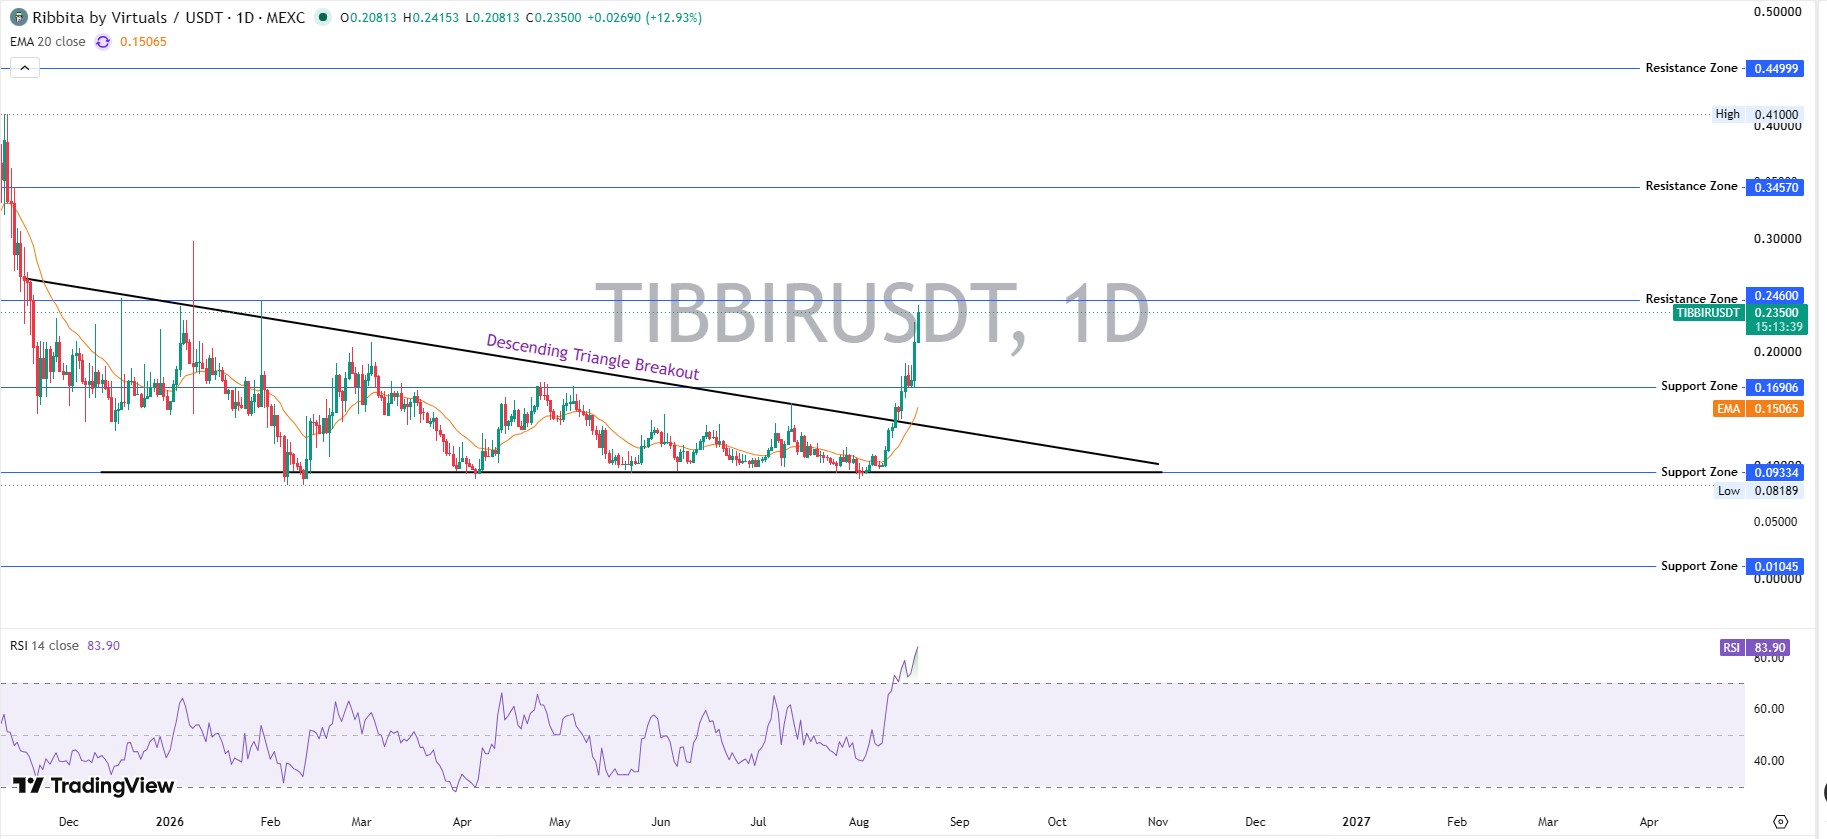
RSI 14 reads 83.90. That's firmly overbought. And it's not a reason to panic; it's a reason to expect a pause or a pullback before the next leg.
The 20-day EMA sits at $0.15065, far below current trading levels, meaning short-term momentum has stretched well past its average pace. Immediate resistance sits at $0.246, then $0.3457, and then $0.44999 near the prior high. Support builds at $0.169, then a deeper shelf at $0.09334.
We'd call this a momentum breakout still hunting for confirmation. One clean daily trade above $0.246 on strong volume would say a lot. Full chart details are visible on TradingView's charting platform.
Ribbita Whale and Holder Analysis
Here's the thing: 74,874 wallets hold TIBBIR, but the top 100 addresses control 46.98% of supply. That's concentrated. Whale wallets, defined as addresses holding at least 1% of tier value, make up just 1.82% of holders yet control 89.41% of market cap.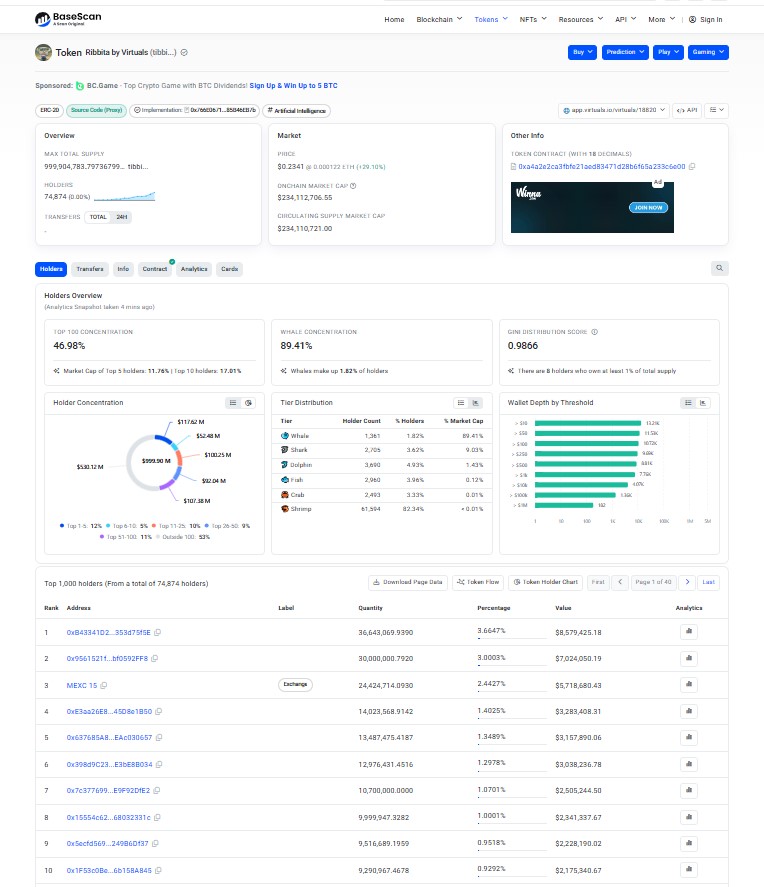
The Gini distribution score reads 0.9866, close to maximum inequality. One exchange wallet (MEXC 15) holds 2.44% of supply. The rest of the top ten looks like a mix of early holders and unidentified addresses, not clearly tagged as treasury or vesting contracts. Full wallet-tier data sits on BaseScan's holder dashboard.
That concentration is the single biggest wildcard behind any Ribbita price prediction. A handful of wallets could move this chart in either direction.
Ribbita AI Agent Token: Why the Category Matters
TIBBIR runs on the Virtual Protocol, placing it inside the AI agent token category rather than a straight memecoin. These tokens tend to trade on narrative momentum around autonomous agents, on-chain identity, and automation tools, not just speculation.
That narrative link explains part of today's volume. AI-themed tokens across the sector caught a bid this week, and TIBBIR rode that wave alongside its own chart breakout. Whether that holds depends on the broader AI-agent trade staying hot, not just this token in isolation. Readers tracking the category can check the crypto price prediction hub for comparable setups.
Ribbita Price Prediction: Bear, Base, and Bull Scenarios
| Timeframe | Bear Case | Base Case | Bull Case | Probability | Invalidation |
| 7 Days | $0.169 | $0.21 - $0.24 | $0.2460 - $0.30 | Bear 25% / Base 50% / Bull 25% | Daily trade below $0.169 |
| 30 Days | $0.093 - $0.14 | $0.18 - $0.25 | $0.3457 | Bear 30% / Base 45% / Bull 25% | Weekly trade below $0.093 |
| Early 2027 | $0.05 - $0.09 | $0.20 - $0.30 | $0.40 - $0.4499 | Bear 30% / Base 40% / Bull 30% | Loss of $0.093 support with rising holder exits |
These targets come from current chart structure, the EMA gap, and historical volatility since the token's January 2025 low, not a guess pulled from thin air. No target here is a promise. Markets don't work that way, and anyone claiming a guaranteed number isn't being straight with you.
Key Support and Resistance Levels for TIBBIR
Support: $0.169, then $0.09334, then a long-term floor near $0.01045. Resistance: $0.246, then $0.3457, then $0.44999.
A daily trade back under $0.169 would weaken the bullish case fast. Clearing $0.246 with real volume, not a wick, would open the door toward $0.3457.
Risks That Could Break the Ribbita Price Forecast
Whale concentration tops the list. Nearly 90% of supply sitting with under two percent of holders means a few large sells could crush this rally without warning.
Thin liquidity is the second risk. A 1.53% volume-to-market-cap ratio means large orders move price more than they should on a healthier token.
Regulatory shifts matter too. The EU MiCA regulation update could shift sentiment across small-cap tokens like this one within weeks, not months.
The ongoing Clarity Act developments in the US add another layer of uncertainty for tokens this size.
Broader macro conditions play a role as well. The Fed policy outlook tends to ripple into risk assets generally, and TIBBIR is not immune to that pull.
Conclusion: Where This Leaves the Ribbita Price Forecast
TIBBIR broke a real pattern on real volume, and that's not nothing. But whale concentration and thin liquidity mean this could reverse just as fast as it climbed.
Watch $0.169 as the line in the sand. Hold above it, and the base case toward $0.25-$0.30 stays alive into 2027. Lose it, and the bearish path opens up quickly.
For ongoing coverage tied to this token, the TIBBIR whale supply data tracks this closely.
Anything on the horizon shows up first on the exchange listing tracker and the coin events calendar.
Disclaimer
This article is for informational purposes only and does not constitute financial, investment, or trading advice. Cryptocurrency markets, including tokens like TIBBIR, are highly volatile and carry significant risk, including total loss of capital.
Prices, market cap, and holder data referenced here were captured on August 19, 2026, near 15:13 UTC from CoinMarketCap, BaseScan, and TradingView and can change quickly. Always do your own research and consult a licensed financial advisor before making investment decisions.
0
0

 Manage all your crypto, NFT and DeFi from one place
Securely connect the portfolio you’re using to start.