
GRAM (prev. TON) price prediction 2026-2032: Will GRAM reach $10?

0
0
Key takeaways:
- Our GRAM (prev. TON) price prediction anticipates a high of $3.35 in 2026.
- In 2028, it will range between $7.26 and $9.49, with an average price of $7.60.
- In 2030, it will range between $17.71 and $20.42, with an average price of $18.27.
In June, the TON community voted in favor of renaming Gram to Gram, with the ticker changing from GRAM (prev. TON) to GRAM. The change took effect on June 15, 2026. The blockchain itself stays The Open Network. Only the token’s name, ticker, and logo change.
Our GRAM (prev. TON) price prediction expects Gram to reach a high of $3.35 in 2026, move above $10 in 2029, and climb to an average price of $37.37 by 2032. For traders, investors, and crypto enthusiasts tracking Gram, this forecast explains the token’s current price, historical performance, technical analysis, market sentiment, and the price outlook from 2026 through 2032 so readers can make more informed investment decisions.
GRAM (prev. TON) (The Open Network) is a decentralized protocol developed by Telegram for the community. The protocol is a distributed supercomputer, or “super server,” comprising GRAM (prev. TON) Blockchain, GRAM (prev. TON) DNS, GRAM (prev. TON) Storage, and GRAM (prev. TON) Sites. The native token for the GRAM (prev. TON) ecosystem is called Gram (TON).
Gram is the native cryptocurrency of The Open Network and is used for transactions, digital payments, and network-level services, including Telegram Premium and ad purchases. Because Telegram integration gives GRAM access to more than 900 million monthly active users, changes in adoption, sentiment, and utility can materially affect future demand and price growth in a volatile crypto market.
Overview
| Cryptocurrency | Gram |
| Symbol | GRAM |
| Current price | $1.39 |
| Market cap | $3.81B |
| Trading volume | $97M |
| Circulating supply | 2.73B |
| All-time high | $8.24 on Jun 15, 2024 |
| All-time low | $0.3906 on Sep 20, 2021 |
| 24-hour high | $1.42 |
| 24-hour low | $1.32 |
GRAM price prediction: Technical analysis
| Metric | Value |
| Volatility (30-day variation) | 6.91% (High) |
| 50-day SMA | $1.56 |
| 200-day SMA | $1.52 |
| Market sentiment | Bearish |
| Green days | 12/30 (40%) |
| Fear and Greed Index | 25 (Extreme Fear) |
GRAM (prev. TON) price analysis
Gram price movements are shaped by supply and demand, and by fundamental factors such as hacks or other market events, while investor sentiment can also affect GRAM price movements and quickly increase price volatility.
Large holders, or whales, can influence short-term price movements, and investors also contribute to short term volatility through financial speculation in the GRAM (formerly TON) market.
GRAM on Aug 4 was down 1.33% in 24h and down 21.48% in 30 days. Its short-term current forecast is based on technical factors and broader market conditions.
GRAM/USD 1-day chart price analysis
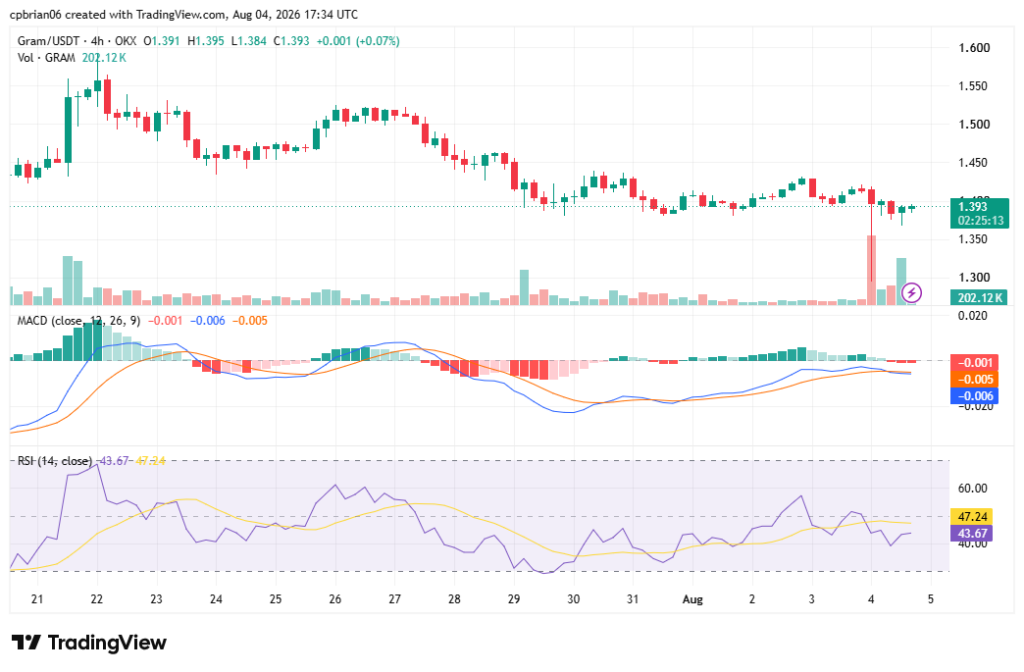
GRAM (prev. TON) turned bearish this month with key support at $1.36. The run was accompanied by rising trading volumes.
Each candle shows the opening, closing, highest, and lowest prices for the session. The latest candlestick pattern on candlestick charts suggests an undecided market – short candles. Traders can use Fibonacci retracement to identify key price levels and spot potential price pullbacks.
Traders use this price action view to predict Gram and to gauge momentum using indicators such as the RSI. The Relative Strength Index (RSI) is a momentum oscillator: readings above 70 can signal overbought conditions, and below 30 can signal oversold conditions, while the current RSI of 40.47 points to a neutral market as traders also watch resistance zones when judging a breakout attempt.
GRAM/USD 4-hour chart price analysis
The 4-hour chart shows GRAM producing long candles this week, with negative market momentum. Many traders watch this timeframe for short-term moves and near-term market trends. Traders are now watching to see whether GRAM (prev. TON) breaks below the $1.35 psychological support zone; a recovery above $1.43 could restore upward momentum and increase buying pressure. In the coming days and into next week, direction will likely depend on whether GRAM (prev. TON) can defend that level and reverse from overbought territory. Its RSI is at 47.24.
GRAM (prev. TON) technical indicators: Levels and action
In technical analysis, moving averages use the average closing price over selected periods to help spot support levels and resistance levels.
Daily simple moving average (SMA)
| Period | Value ($) | Action |
| SMA 3 | 1.41 | SELL |
| SMA 5 | 1.41 | SELL |
| SMA 10 | 1.44 | SELL |
| SMA 21 | 1.47 | SELL |
| SMA 50 | 1.56 | SELL |
| SMA 100 | 1.70 | SELL |
| SMA 200 | 1.52 | SELL |
Daily exponential moving average (EMA)
| Period | Value ($) | Action |
| EMA 3 | 1.41 | SELL |
| EMA 5 | 1.42 | SELL |
| EMA 10 | 1.43 | SELL |
| EMA 21 | 1.47 | SELL |
| EMA 50 | 1.55 | SELL |
| EMA 100 | 1.59 | SELL |
| EMA 200 | 1.69 | SELL |
What to expect from the GRAM (prev. TON) price analysis next?
If GRAM (prev. TON) fails to hold the key support near $1.36, price could slip back toward lower support around $1.30, setting near-term targets in that zone. The relative strength index remains neutral, and broader crypto sentiment could determine whether this setup turns into renewed weakness or a recovery, though the current technical picture does not yet confirm fresh downward momentum. Multiple technical quantitative indicators and moving averages support a neutral GRAM forecast over the short term.
Is GRAM (prev. TON) a good buy?
According to Cryptopolitan price predictions, GRAM (prev. TON) will trade higher in the years to come. However, both technical analysis and fundamental analysis Toncoin can support or invalidate this bullish case for investors deciding whether to buy Gram. Even so, GRAM (prev. TON) remains highly risky, so readers should do their own research before deciding whether GRAM is a good investment.
Will GRAM (prev. TON) reach $10?
Yes, GRAM (prev. TON) should rise above $10 in 2029. Some toncoin price prediction models project a peak near $10 as early as 2027, though this forecast is more conservative. The move will come as the market recovers to previous highs.
Will GRAM (prev. TON) reach $100?
Per the Cryptopolitan price prediction, GRAM (prev. TON) is unlikely to reach $100 before 2031.
Will GRAM (prev. TON) reach $1,000?
According to the Cryptopolitan price prediction, GRAM (prev. TON) is unlikely to reach $ 1,000 before 2031.
Does Gram have a future?
GRAM has been on a bullish run since its inception, despite seasonal market corrections. Future growth will depend in part on the development of more decentralized applications, decentralized storage, and mini apps on the TON network, while future performance will also hinge on user adoption and a growing ecosystem within Telegram, where Gram enables smart contracts for various applications and supports real-world utility. Gram also serves as a fee for cross-chain transactions, and growing demand for toncoin ton as a utility asset across payments and applications could further support its value. The GRAM blockchain has a vibrant community of users and developers, with access to a broad base of Telegram users, and strong network activity, such as transaction volume and on-chain activity, can signal long-term strength. Looking ahead, Gram has the potential to trade higher in the coming years.
Recent news
Russia’s Federal Security Service (FSB) has charged Pavel Durov, founder of Telegram, with facilitating terrorist activity and placed him on an international wanted list, a direct escalation of a criminal case that first surfaced in February 2026.
GRAM (prev. TON) price prediction August 2026
The GRAM (prev. TON) August 2026 GRAM coin price prediction is an expected range of $1.67 to $2.30. It will average at $1.32. Even over a single month, future prices can still be affected by short-term sentiment swings.
| Period | Potential low ($) | Potential average ($) | Potential high ($) |
| August | 1.67 | 1.32 | 2.30 |
GRAM price prediction 2026
As 2026 unfolds, GRAM remains bullish within the broader cryptocurrency market, though the outlook will still depend on macroeconomic conditions. The price will range between $0.97 and $4.35, with the average TON price for 2026 projected at $2.23.
| Year | Potential low ($) | Potential average ($) | Potential high ($) |
| 2026 | 0.97 | 1.63 | 3.35 |
GRAM (prev. TON) price prediction 2027-2032
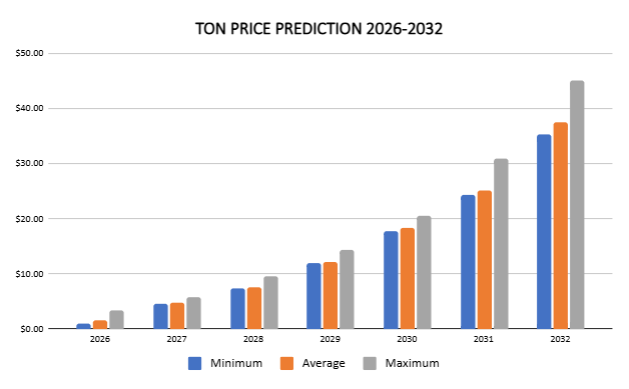
Long-range TON coin price prediction models often combine quantitative and qualitative inputs. Analysts may also use multiple scenarios to estimate future prices over 2027-2032.
| Year | Potential low ($) | Potential average ($) | Potential high ($) |
| 2027 | 4.48 | 4.80 | 5.71 |
| 2028 | 7.26 | 7.60 | 9.49 |
| 2029 | 11.84 | 12.22 | 14.29 |
| 2030 | 17.71 | 18.27 | 20.42 |
| 2031 | 24.31 | 25.16 | 30.81 |
| 2032 | 35.21 | 37.37 | 45.12 |
GRAM price prediction 2027
The GRAM (prev. TON) token prediction climbs even higher into 2027. According to the prediction, the toncoin price will range from $4.48 to $5.71 in 2027, with an average of $4.80, though regulatory developments and investor sentiment could affect the path toward that range.
GRAM price prediction 2028
The analysis suggests a further acceleration in TON’s price. GRAM (prev. TON) will trade between $7.26 and $9.49. It will average at $7.60.
GRAM price prediction 2029
According to the Gram forecast for 2029, the price of GRAM (prev. TON) will range from $11.84 to $14.29, with an average of $12.22. Even if the longer-term outlook stays bullish, regulatory uncertainty could slow momentum.
GRAM price prediction 2030
The GRAM price prediction for 2030, reflecting the expected toncoin ton price range, is $17.71 to $20.42. The average price of Gram will be $18.27.
GRAM (prev. TON) price prediction 2031
The Gram price forecast for 2031 has a high of $30.81. However, when the market corrects, GRAM (prev. TON) will reach a minimum price of $24.31 and an average of $25.16. Whether it reaches that upper target will also depend on broader market conditions and the adoption of digital assets.
GRAM price prediction 2032
In 2032, there will be more bullish momentum. According to the GRAM (prev. TON) price prediction, it will range between $35.21 and $45.12, with an average trading price of $37.37.
GRAM market price prediction: Analysts’ GRAM price forecast
| Platform | 2026 | 2027 | 2028 |
| Coincodex | $2.07 | $2.74 | $3.43 |
| Gate.com | $1.38 | $1.59 | $1.82 |
Cryptopolitan GRAM (prev. TON) price prediction
Our predictions indicate that GRAM (prev. TON) will reach a high of $3.35 in 2026. In 2028, it will range between $7.26 and $9.49, with an average of $7.60. In 2030, it will range between $17.71 and $20.42, with an average of $18.27. Note that the predictions are not investment advice. Seek independent professional consultation or do your research before making any investment decision. Crypto assets are highly risky, and there may be limited regulatory recourse for losses from such transactions.
GRAM (prev. TON) historic price sentiment
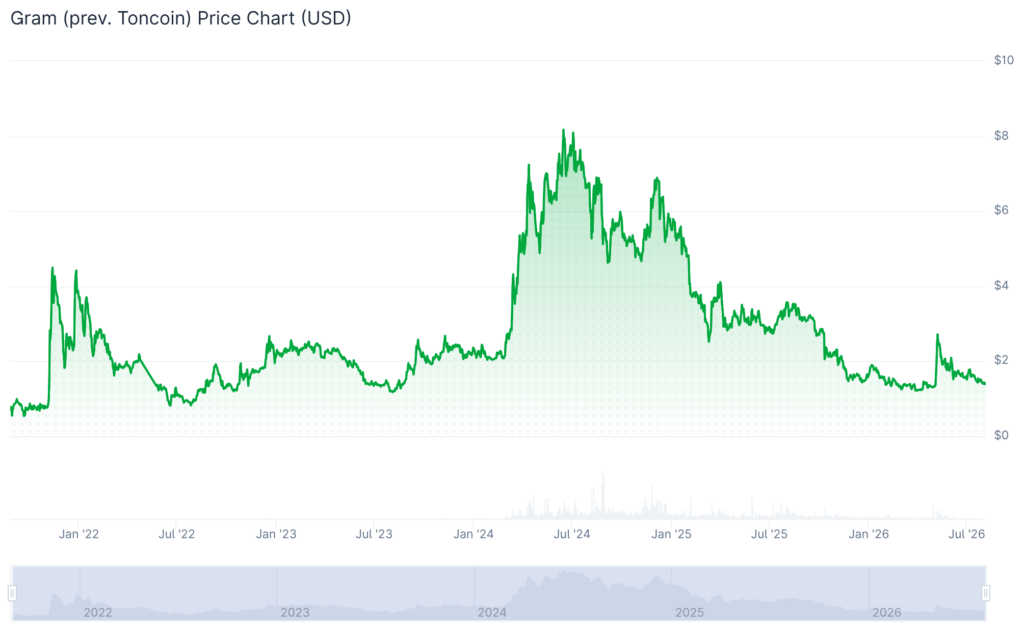
GRAM (prev. TON) price history by CoinGecko
- GRAM is the native cryptocurrency of The Open Network, which launched in 2018 as the Telegram Open Network before being renamed and taken over by the TON Foundation. The chain uses proof of stake to support smart contracts and low-cost transactions, and its ties to the Telegram ecosystem provide access to a large user base.
- In June 2020, all Gram tokens (98.55% of the total supply) became available for mining, further widening access to that user base.
- The tokens were placed in special Giver smart contracts, enabling anyone to mine until 28 June 2022. Users mined around 200,000 GRAM (prev. TON) daily.
- All the tokens were mined in two years, marking the completion of the distribution event.
- On September 20, 2021, GRAM (prev. TON) reached its all-time low of $0.3906.
- Its first significant break came in November 2021. Over the past few days, the coin has slid from $0.8 to $4.5.
- It corrected in 2022, reaching a low of $0.9.
- In 2023, it ranged between $1.1 and $2.5.
- In 2024, it registered another bull run, rising from $2.11 to its all-time high of $8.24 on Jun 15, 2024.
- It corrected later, trading at $ 5.20 in October and $4.98 in November, when it began to recover.
- The recovery saw the coin rise above $6.5 in December.
- It then crossed into 2025, trading at $5.5. From there, it entered a bear market, falling below $3.8 in February and $3.0 in May. It crossed into June at $3.20 and maintained that level into August. In October, it fell to $3.00, and in November to $2.50, with shifts in network activity and user adoption helping shape sentiment through the decline.
- In December, it traded at $1.60 and rose above $1.80 in January 2026.
- The trend reversed in February, falling below $1.40. In May, at $1.35. In June, it crossed above $1.50, and in July, it crossed above $1.80 as activity improved during the rebound.
- In August, it retreated to $1.40.
0
0

 Manage all your crypto, NFT and DeFi from one place
Securely connect the portfolio you’re using to start.