Stellar (XLM) faces $0.182 rejection: breakout or pullback ahead?

0
0

Stellar’s (XLM) price action mirrors that of Bitcoin and Ether as it is currently down by nearly 2% in the last 24 hours.
The coin is trading above $0.17 on Thursday after taking out the $0.182 swing high on Wednesday.
Despite facing rejection on the 4-hour and daily timeframes, improving sentiments from the derivatives market suggest an upside continuation for XLM in the near term.
XLM’s derivatives data shows bullish bias
XLM is down nearly 2% in the last 24 hours as the sellers pushed the price lower after it took out the $0.182 swing high a few hours ago.
However, XLM’s derivatives data remains bullish.
CoinGlass’s data shows that the futures’ Open Interest (OI) in Stellar at exchanges stands at $114.71 million on Thursday, up from $84.64 million recorded earlier this week, reaching levels not seen since January 20.
An increasing OI represents new or additional money entering the market and new buying, which could fuel the current XLM price rally.
Furthermore, Stellar’s funding rates flipped positive on Monday and now read to 0.0103% on Thursday, indicating that longs are paying shorts.
Similar to other cryptocurrencies, when XLM’s funding rates flip from negative to positive and increase, the Stellar price has rallied sharply.
XLM’s stablecoin market cap reaches record highs, adding further bullish confluence to the coin.
Data obtained from the crypto intelligence tracker DefiLlama shows that Stellar’s stablecoin market capitalisation increased from $181.12 million in early January to $361.02 million on Wednesday, hitting a new all-time high in the process.
Rising stablecoin market capitalization and increasing network activity suggest growing confidence and interest within the Stellar ecosystem, and this could push XLM’s price higher in the near to medium term.
XLM bulls remain in control
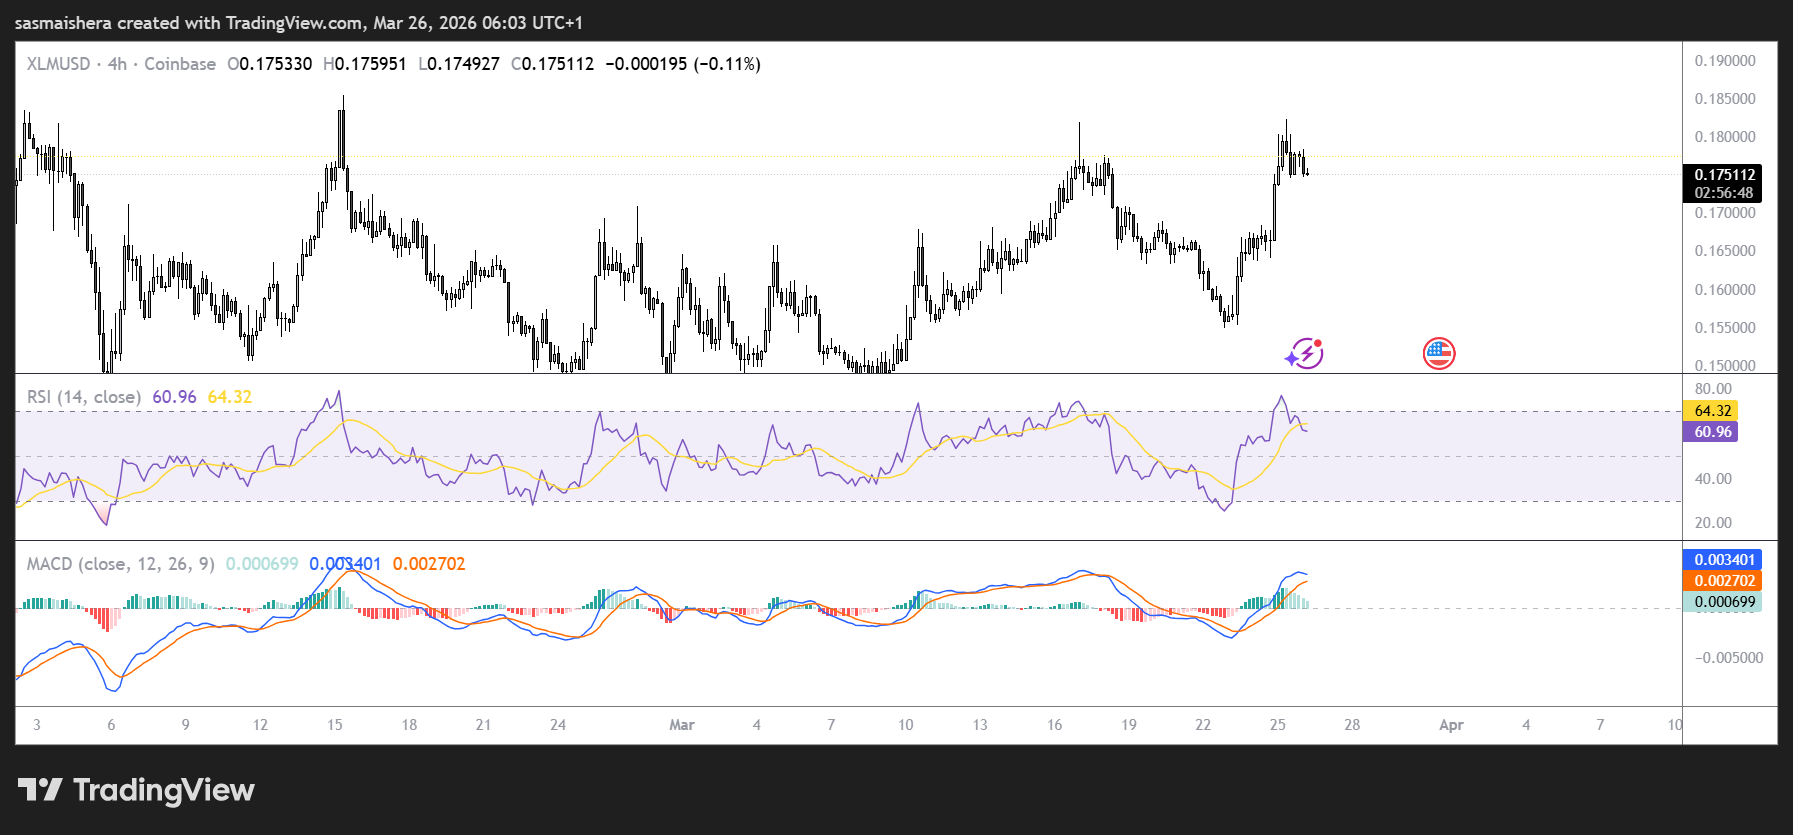
XLM is trading at $0.1749 as the 4-hour chart remains bearish and efficient. The near-term bias remains bullish despite the price rejection on the same timeline.
If the $0.170 support level holds and the daily candle closes above this zone, XLM would reduce the downside grip of the still-declining 100-day EMA near $0.19.
The momentum indicators have improved in recent days.
The Relative Strength Index (RSI) on the 4-hour chart reads 64m, while the Moving Average Convergence Divergence (MACD) line remains over its signal, suggesting strengthening upside pressure rather than a mere oversold bounce.
If the rejection pushes the price lower, XLM will likely retest the $0.170 support level in the near term, which aligns with its 50-day EMA.
An extended bearish run would expose the secondary support at the $0.16 area, where the latest consolidation began.
Failure to defend this area could see buyers step in around the $0.15 psychological level.
On the flip side, if the bulls overcome the $0.182 resistance and close the daily candle above this level, the 100-day EMA at $0.190 would become the next major target.
The $0.20 psychological level could also serve as another resistance level in the near term, with the $0.24 level proving difficult in the near term.
The post Stellar (XLM) faces $0.182 rejection: breakout or pullback ahead? appeared first on Invezz
0
0


 Manage all your crypto, NFT and DeFi from one place
Securely connect the portfolio you’re using to start.


0
0

0
0