
A Historic Bitcoin Supply Squeeze Is Taking Shape: What Comes Next?

0
0


Bitcoin’s short-term holder supply just hit one of its lowest levels ever. Fewer recent buyers now hold BTC than at almost any point in history. That kind of setup has shown up before, and it usually matters.
A Signal Worth Watching, According To On-Chain Data
Lucky, a Bitcoin holder since 2015 with a large following on X, pointed out that Bitcoin’s short-term holder supply is compressed.
He said this level is worth watching if you’ve been through past cycles. Historically, this kind of squeeze tends to show up in the later stages of a bear market.
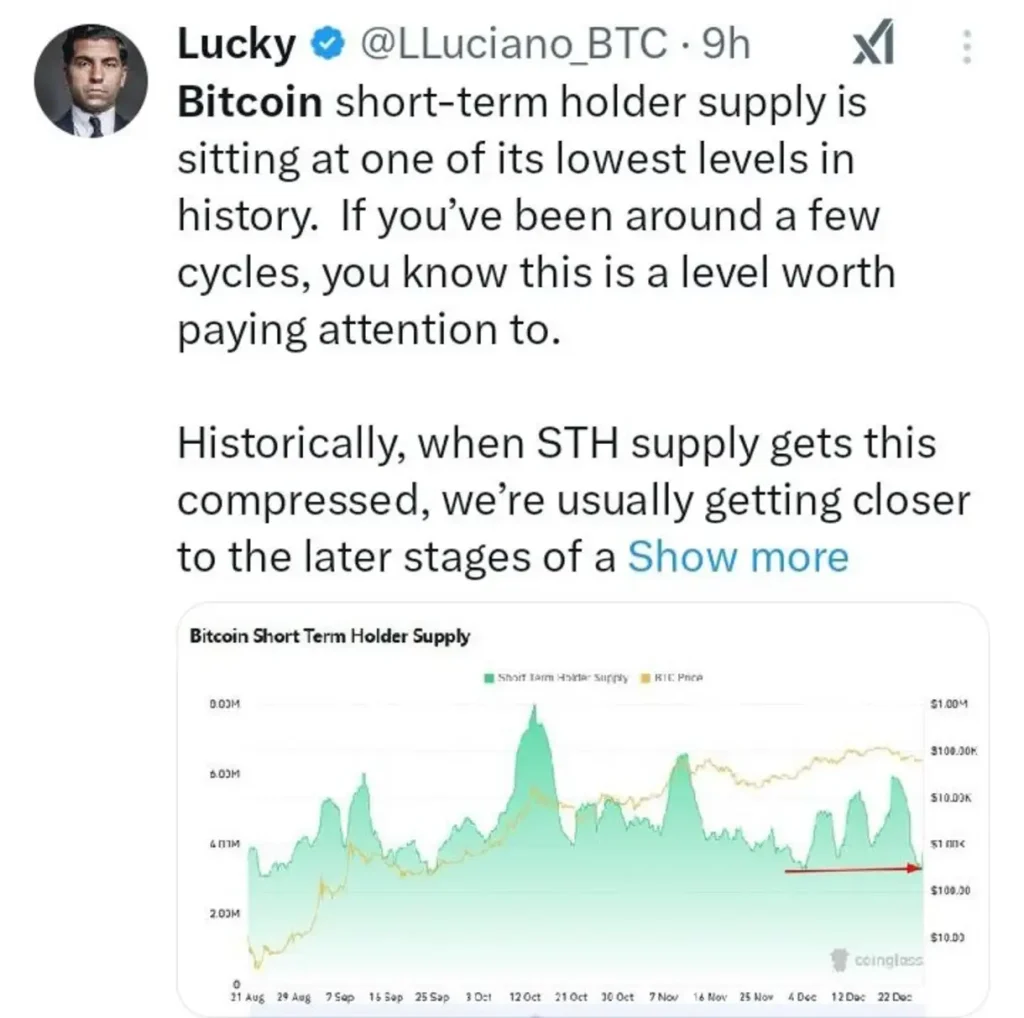
His chart tracked short-term holder supply against BTC price going back years. The pattern is clear. Supply shrinks sharply near past cycle bottoms.
Why Shrinking Short-Term Supply Matters
Short-term holders are addresses that bought BTC less than 155 days ago. They tend to sell fast when price moves against them.
When their supply shrinks this much, it means most of the weak hands have already sold or moved on.
What’s left is a market held mostly by long-term holders who are less likely to panic sell. That kind of holder base tends to create a firmer price floor.
The Data Backs Up The Signal
Bitcoin is currently wedged between the median realized price near $63,000 and the short-term holder cost basis around $68,700.
Spot volume has dropped to its lowest point since 2019. Supply in profit sits close to past bear-floor territory too.
ETF inflows remain thin, and coins keep landing on exchanges, but leverage stays crowded on the long side.
Techgaged flagged a similar setup back in June, when Bitcoin traded near what several analysts called a historic bottom zone amid weak ETF demand.
Not only that, in recent times, it also tracked the coin’s whale-driven exchange outflows as a sign that large holders were already positioning for a longer hold.
Not Everyone Agrees This Is The Bottom
Some analysts remain cautious. A weak market response to good news can itself be a warning sign, according to Glassnode’s latest research note.
Break-even levels have rejected nine recovery attempts so far this year, and buyers still look scarce compared to the seller side.
Bitcoin also keeps lagging traditional equities, which sit near record highs. That gap suggests demand simply hasn’t shown up yet, even if supply pressure looks favorable.
What The Chart Shows
As of 06:51 UTC on August 14, 2026, BTC/USD trades at $63,111.61 on the weekly chart, down 0.49%.
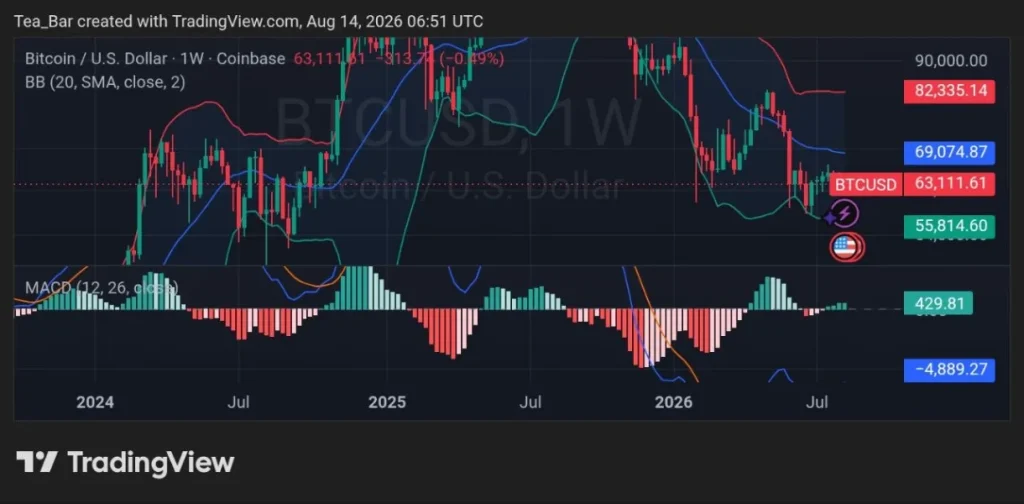
Price sits below both Bollinger Bands, with the middle band near $69,075 and the lower band near $55,815.
The weekly MACD histogram has turned green after months of red bars through 2026, a shift that has marked early recovery phases in past cycles.
Whether this supply squeeze marks the start of a real turn or just another pause in a longer downtrend is something only the coming weeks will show.
Disclaimer:
This article is for informational purposes only and does not constitute financial, investment, or trading advice. The views expressed are based on publicly available data, market observations, and the author’s interpretation at the time of writing. Cryptocurrency markets are highly volatile and unpredictable, and past performance or current technical setups do not guarantee future results. Readers should conduct their own research and consult with a qualified financial advisor before making any investment decisions. TechGaged does not accept liability for any losses incurred based on the information presented.
The post A Historic Bitcoin Supply Squeeze Is Taking Shape: What Comes Next? appeared first on TechGaged.com.
0
0

 Manage all your crypto, NFT and DeFi from one place
Securely connect the portfolio you’re using to start.

0
0

0
0


0
0