Avalanche (AVAX) Flashes Buy Signal, $30 Ahead?

0
0
Coinspeaker
Avalanche (AVAX) Flashes Buy Signal, $30 Ahead?
Avalanche (AVAX) is trading at $19.92 at press time, flashing signals that hint at a potential breakout. After dropping to $16 following its slide from a $54 local peak, the token has rebounded nearly 9% over the past month.
AVAX recently bounced off its 200-day Simple Moving Average (SMA), a level often watched by traders to determine long-term trend direction. Meanwhile, as popular analyst Ali Martinez noted, the TD Sequential indicator flashed a fresh buy signal on the 4-hour chart.
#Avalanche $AVAX is bouncing off the 200SMA, with the TD Sequential flashing a buy signal on the 4-hour chart! pic.twitter.com/l6ZYvdp5IJ
— Ali (@ali_charts) May 5, 2025
As per the data by CoinMarketCap, AVAX has added more than $2 billion to its market cap in the past 30 days.
This suggests a short-term trend reversal with crypto analysts growing increasingly bullish. Crypto expert thelordofentry recently noted that AVAX is showing one of the “best reversal prints” among altcoins on the 4-hour timeframe.
$AVAX interestingly the best reversal prints out of most ALTS on the 4hr but the biggest underperformer on this bounce – I am still long here. pic.twitter.com/n3YnjbB1dD
— TheLordofEntry (@thelordofentry) May 5, 2025
However, he also acknowledged it’s been underperforming in the recent bounce.
Meanwhile, AMCrypto believes that a breakout above the $22.8 resistance zone could lead AVAX to the $28–$30 range, citing growing investor appetite for utility-driven altcoins.
$AVAX bull flag formation 🚀
Utility tokens are gaining momentum, so AVAX is most likely to follow this rally.
If AVAX manages to break above $22.8, expect a rally towards $28-$30 in the coming weeks. pic.twitter.com/b1hNmCZ64y
— AMCrypto (@AMCryptoAlex) April 28, 2025
AVAX Price Outlook
On the daily AVAX price chart, the RSI is currently at 45.6, suggesting the asset is neither overbought nor oversold and leaving ample room for upward direction. A bullish divergence from RSI lows formed in April hints at a potential bullish reversal brewing.
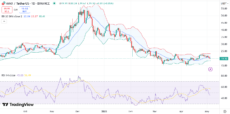
AVAX price chart | Source: Trading View
The price is trading in a tightening range notable in the narrowing Bollinger Bands, often a precursor to increased volatility. The price is hovering near the middle band (20-day SMA), indicating trader indecision.
A breakout above $22.8 could lead to a bullish expansion. However, if the token breaks below $18.4, the lower band, it may see further downside.
The MACD lines are showing a potential bullish crossover above the zero line. If the MACD line crosses back above the signal line, it could reignite upward pressure.
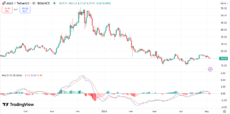
AVAX price chart | Source: Trading View
Interestingly, a rounding bottom pattern is emerging on the daily chart, a bullish reversal formation. If confirmed with a break above $22.8, it could confirm a rally toward $30.
0
0

 Manage all your crypto, NFT and DeFi from one place
Securely connect the portfolio you’re using to start.

0
0


0
0

0
0