
Shiba Inu Price Prediction: Can $SHIB Break Out This Week?

0
0

Honestly, this shiba inu price prediction comes down to one thing: can buyers finally push $SHIB out of the narrow band it's been stuck in for days now? Price is still well off the highs it touched earlier this year, and it's not alone there.
DOGE and PEPE have both cooled off in a similar way. BONK, by contrast, has been whipping around with much bigger single-day moves lately, so $SHIB actually looks unusually quiet in comparison, grinding higher or lower in small steps rather than sharp spikes.
If buyers step in with real volume, the upper end of the range is within reach. If they don't, expect a retest of levels SHIB hasn't touched in weeks.
SHIB Price Snapshot
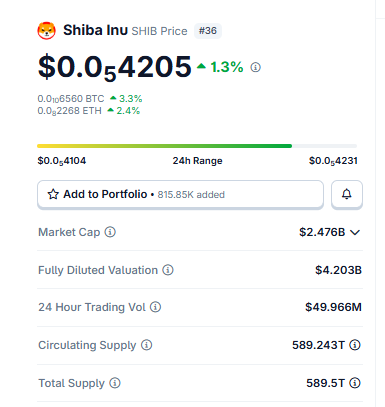
Source: Data Taken From Coingecko, data as of July 25, 2026. Figures may vary slightly across other tracking websites
SHIB Liquidation Heatmap: Short Squeezes Dominate The Short Term
As per the Coingalss liquidation data numbers, they tell a slightly split story. In the last hour, about $1.51K in short positions got flushed out with barely any longs touched, and the four-hour window shows almost the same thing at $1.52K. Small, sharp squeezes to the upside, basically. 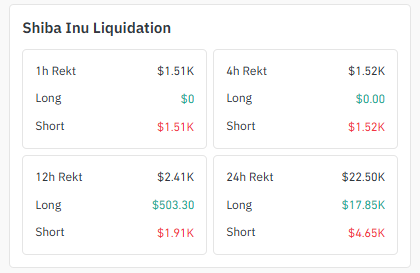
Source: liquidation data taken from Coinglass,
Stretch that out to a full day, though, and it flips. Total 24-hour liquidations sit at $22.50K, but this time longs take the bigger hit at $17.85K against only $4.65K in shorts.
So traders betting on a bounce have been getting burned more often across the day, even while the last few hours favored shorts getting squeezed.
That kind of back-and-forth is pretty typical when a coin is stuck inside a range like this one.
$SHIB Exchange Volume Heatmap
Most of the action is happening on a few exchanges.
LBank tops the futures volume charts right now at $11.10M, OKX isn't far off at $8.40M, and then it thins out through MEXC ($4.07M), Bitget ($3.35M), and Bitunix ($2.05M). Kraken and KuCoin barely register by comparison. 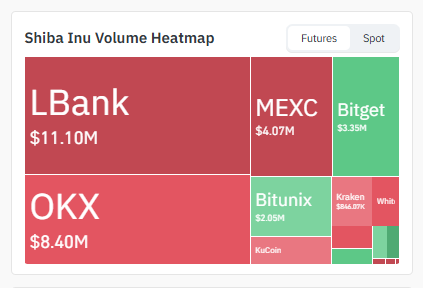
Source: Volume heatmap data taken from Coinglass at 25-07-2026
That concentration in derivatives volume, rather than spot, is a decent hint that leveraged traders, not long-term buyers, are steering short-term price swings right now.
Holder Concentration and Shiba Inu Whale Activity
The ownership numbers are pretty lopsided, honestly. Just the top 100 wallets hold 83.17% of all SHIB in circulation, and whale wallets, which make up a mere 0.04% of holders, sit on 94.48% of the market cap.
The Gini score comes in at 0.9957, about as skewed as it gets, and seven single wallets each own at least 1% of the entire supply. 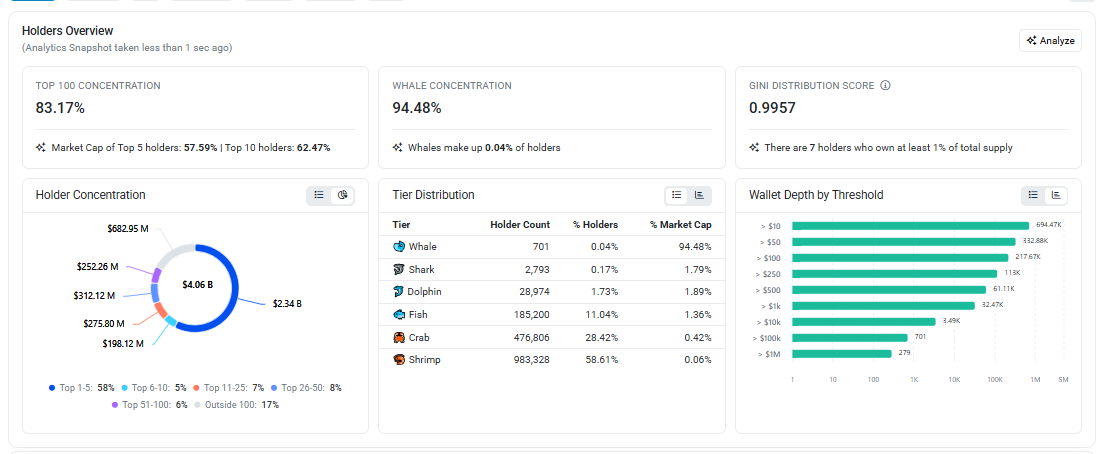
Source: Holder Data Taken From Etherscan, of 25-07-2026
Compare that to the "shrimp" tier: 983,328 small holders sharing just 0.06% of supply between them. With numbers like this, holder concentration isn't just a footnote; it's a real factor in how price can move on short notice.
Worth keeping an eye on shiba inu whale activity, and if those flows ever start turning shiba inu netflow bullish, meaning coins leaving exchanges for cold storage, that would be a genuinely bullish signal to watch for.
Shiba Inu News: Shibarium Activity Climbs
Most of the recent shiba inu news has actually been about Shibarium, not the token itself. Daily transactions on the Layer-2 chain jumped to 1,180, up from just 661 on July 21, a 78.51% climb in a matter of days. 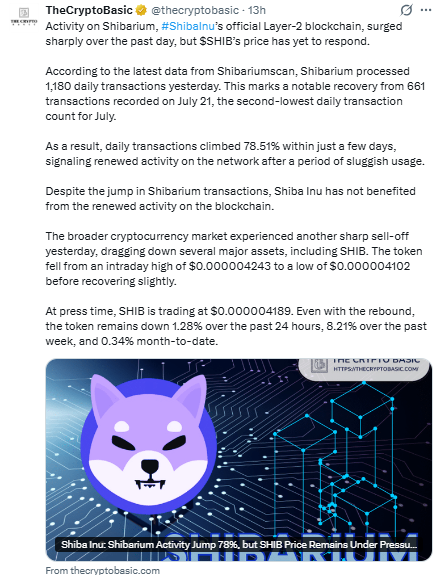
Source: Data Taken From @ThecryptoBasic, X Account
That's a real Shiba Inu Shibarium blockchain milestone, no question. But price hasn't budged much because of it, which tells you the market probably wants to see this activity hold for longer before it starts pricing anything in.
SHIB 4-Hour Chart: Higher Lows Still Intact
Zooming into the 4H, the picture leans a bit more hopeful. SHIB's been printing higher lows step by step inside a rising, ascending channel, and that structure has survived the recent pullback without breaking. 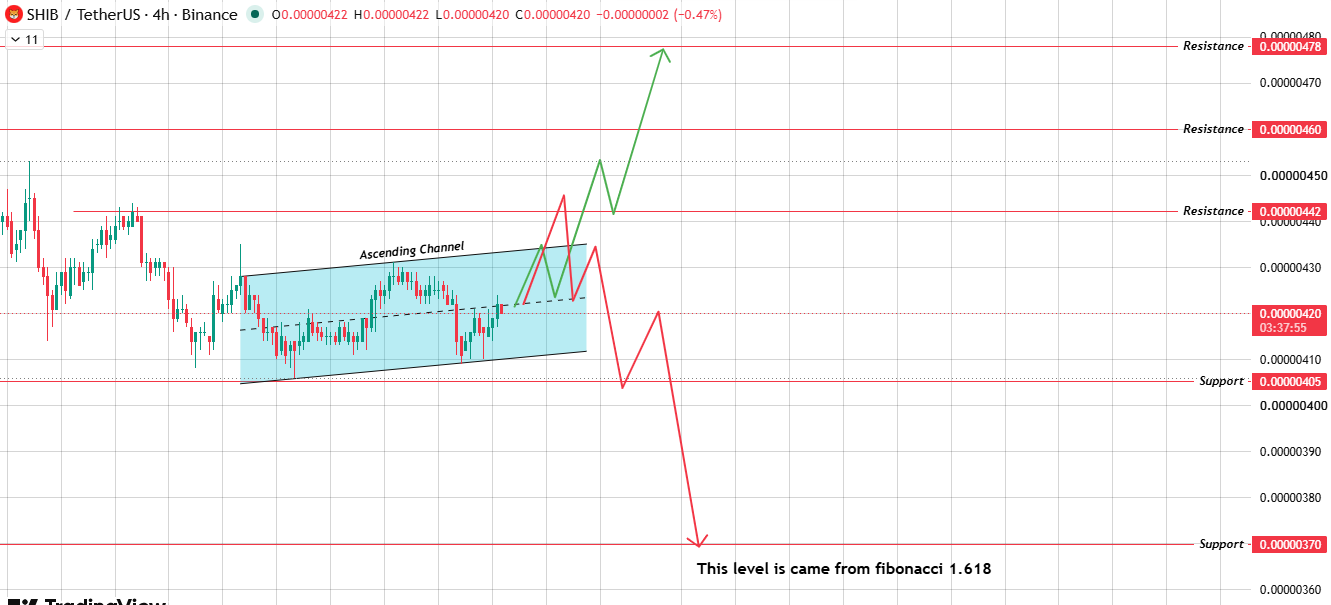
Source: Chart Taken From TradingView, at 25-07-2026
Fine, as long as that trendline support keeps catching every dip, the short-term bias stays mildly bullish.
Get through $0.00000442, and the uptrend is confirmed, with $0.00000460 then $0.00000478 next up.
But if that ascending channel snaps and $0.00000405 gives way too, the structure flips into a descending channel, price stepping down through lower highs and lower lows, and sellers probably take another run at the same $0.00000370 zone from the daily chart.
$SHIB 1-Day Chart: Range-Bound, Waiting For A Trigger
Pull up the daily chart , and SHIB is basically boxed in, sitting between a support zone around $0.00000405 and a resistance level near $0.00000446.
It's been bouncing inside that box for a while now, which usually means traders are waiting on something before they commit either way. 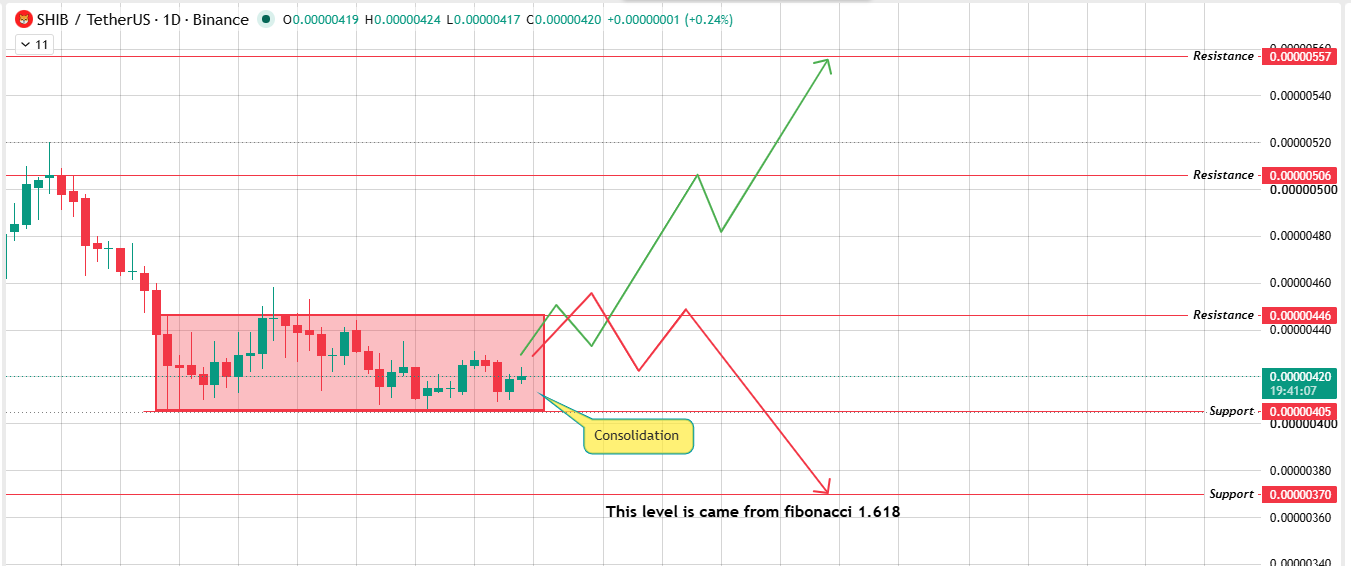
Source: Chart Taken From TradingView, at 25-07-2026
Clear $0.00000446 on a daily close and buyers have the wheel, with $0.00000506 and then $0.00000557 opening up above.
Lose $0.00000405 instead, and the next real floor is $0.00000370, a level that comes straight off a Fibonacci extension rather than a round-number guess.
Bull, Base, and Bear Scenarios
Probability note: Take these scenarios as chart-based framing, not a promise of what happens next. Tokens with supply counts as large as SHIB's can still swing hard on sudden exchange volume spikes, macro headlines, or a whale deciding to sell.
BTC Dominance And Broader Market Correlation
Like most meme coins, its size, $SHIB, rarely moves purely on its own merits. It tends to follow Bitcoin's mood more than its own headlines.
When BTC dominance rises, money usually drains out of smaller tokens like SHIB, and when the tide turns and altcoins get their moment, SHIB has typically been one of the bigger beneficiaries.
So pairing Bitcoin's trend with the levels above gives a much clearer sense of whether a breakout actually has legs.
Key Takeaways
-
SHIB trades near $0.00000420, holding inside a tight range that has capped the price for several sessions.
-
A daily close above $0.00000446 opens the door toward $0.00000506 and then $0.00000557.
-
Losing $0.00000405 support risks a slide toward the $0.00000370 zone.
-
Shibarium daily transactions jumped 78.51% from July 21, though the price has not reacted yet.
-
Whale wallets control 94.48% of supply despite making up just 0.04% of all holders.
Can Shiba Inu Coin Realistically Hit $1?
People ask about the $1 potential for Shiba Inu constantly, so let's just run the math.
Circulating supply sits around 589.243 trillion SHIB, which means a $1 price tag would put the market cap near $589 trillion.
That's not just unrealistic; it's multiple times larger than the entire global economy. Bitcoin, the biggest asset in crypto, still measures its market cap in trillions, not hundreds of trillions.
A more grounded long-term path for the Shiba Inu coin looks like steady supply burns paired with growing demand, not a sudden leap to a dollar.
Expert Opinion
If I'm being straight about it, this setup looks more like a coiled spring than anything with a clear bias built in.
Both the daily range and the 4H higher-lows structure are still holding, and neither has broken cleanly one way or the other.
Shibarium's transaction growth hasn't moved price yet, and whale concentration remains about as extreme as it gets. Given all that, waiting for one of these levels to actually break makes more sense than guessing which side wins first.
Final Outlook: Will Shiba Inu Go Up?
So, will shiba inu go up from here? Honestly, it comes down to which side of the range gives first, and right now this is a genuine coin flip.
Break and hold above $0.00000446, and momentum turns firmly bullish. Lose $0.00000405 instead, and $0.00000370 becomes the next stop.
Treat this shiba inu price prediction as a framework to react to, not a forecast to bet the farm on. And for anyone buying SHIB, whether that's through Shiba-Inu Robinhood or elsewhere,
it's usually smarter to wait for one of these levels to actually break than to chase the price mid-range.
Glossary
Support zone: A price area where buying pressure has historically stepped in to slow or reverse a decline.
Resistance level: A price area where selling pressure has historically capped rallies.
Trendline support: A rising or falling line connecting a series of price lows or highs, used to gauge short-term trend direction.
Liquidation heatmap: A visual breakdown of forced position closures across exchanges, often used to spot where leveraged traders are getting squeezed.
Holder concentration: A measure of how much of a token's supply sits in the hands of a small number of wallets.
Methodology
Price levels referenced in this article are derived directly from TradingView chart analysis on the 1D and 4H timeframes for the SHIB/USDT pair on Binance.
On-chain and liquidation data is sourced from Coinglass and on-chain analytics dashboards. This is not financial advice.
Disclaimer: This article is for informational purposes only and does not constitute financial, investment, or trading advice. Cryptocurrency markets, including shiba inu cryptocurrency, are highly volatile and can result in significant losses. Always do your own research and consult a licensed financial advisor before making investment decisions.
0
0


 Manage all your crypto, NFT and DeFi from one place
Securely connect the portfolio you’re using to start.


0
0

0
0
