XRP Price Set for a 2900% Rally As Indicators Turn Bullish?

0
0

Key Insights:
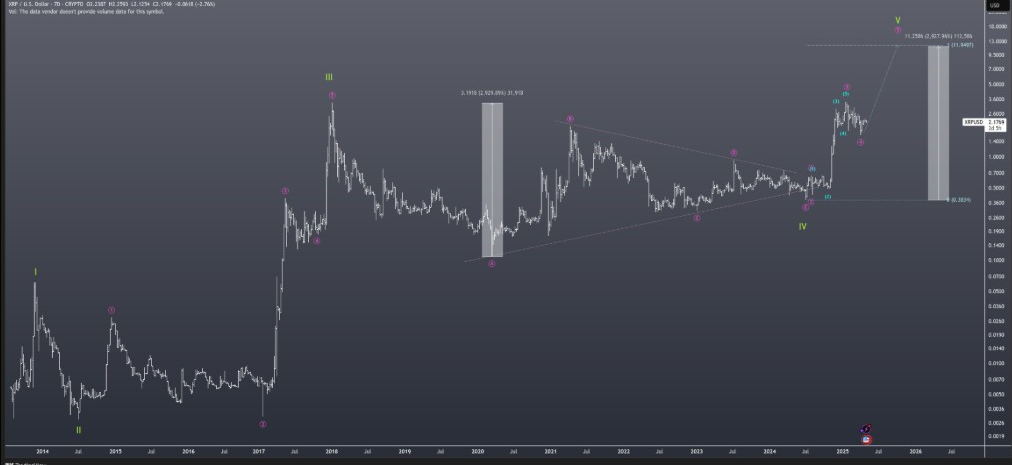
- XRP price completed an Elliott Wave correction phase, positioning for a possible 2,900% surge by 2026.
- Ripple 6-week chart analysis shows XRP forming a bullish flag above a 7-year base, targeting $8–$9 in early price discovery.
- XRP charts show a falling wedge pattern, suggesting a short-term breakout toward the $2.36–$2.59 range.
Ripple’s native crypto, XRP, is on the verge of a large-scale rally based on current technical setups and whale accumulation trends. According to several analysts, XRP price has completed a corrective phase within the Elliott Wave framework.
This positions the altcoin for a potential third wave, historically the most expansive in bullish Elliott Wave cycles.
Analysts suggest this may drive the price of XRP to $12 by 2026, representing a projected 2,900% increase from its current trading range.
On-chain activity supports this view, with recent data showing that whales have accumulated over 440 million XRP tokens in the past month.
Meanwhile, short-term technical indicators show the asset trading near key breakout levels, adding further interest to its price trajectory.
XRP Price Prediction: Analysts Signal 2900% Rally Potential
XRP price has completed its corrective pullback, placing it at the start of a new bullish wave.
The current wave, labeled as Wave 3 in the Elliott sequence, is often the most extended. This phase could lift XRP from the $2 range to as high as $12 by 2026.
EWCycles, a technical analyst, supports this forecast. According to his projection, XRP’s price movement shows signs of transitioning from a consolidation phase to a strong upward trend. The price has been fluctuating between $2.05 and $1.65, forming the base for the next upward push.
Ripple price action on higher time frames showed an ascending channel, typically viewed as a continuation pattern. As long as altcoin maintains its current structure of higher lows and higher highs, this trend may continue.
Analysts are monitoring resistance near $2.36 as a key level in the short term, with $2.59 noted as the next near-term target.
Long-Term Chart View: Ripple Prepares for Major Breakout
Technical analyst Brandon has pointed to a long-term bullish pattern on XRP’s six-week chart. According to his interpretation, XRP is forming a breakout structure based on a historical support zone that has held for over seven years. This level has previously served as a launchpad during past market cycles, including the 2017–2018 bull run.
Brandon identifies a bullish flag structure that followed a breakout candle. This pattern, often viewed as consolidation before further price continuation, signals that Ripple may be entering the fifth wave of the Elliott sequence.
This wave is typically linked with fast upward price action. His analysis projects a move toward $8 to $9 in the early stages of a new price discovery phase.

Additionally, he noted that the current chart structure is more refined compared to earlier market cycles.
The extended consolidation over seven years has formed what he describes as the “7-year XRP base.” He indicates that this strong foundation supports the case for a higher valuation and a long-lasting breakout.
Whale Accumulation Reflects Bullish Sentiment
Moreover, recent blockchain data shows large XRP holders increasing their positions. In the last 30 days, addresses holding between 10 million and 100 million XRP acquired over 440 million tokens. Another cohort, holding 1 million to 10 million XRP, added 190 million coins during the same period.
Such buying activity suggests expectations of future price increases. These investors often accumulate during periods of lower prices to capitalize on upcoming upward movements. The surge in accumulation supports the predictions that XRP price is entering a bullish phase.
The increase in whale holdings adds weight to the technical forecasts, as large investors often react based on long-term market trends and signals.
The synchrony between whale activity and the Elliott Wave analysis creates a case for a strong rally in the coming months.
XRP Price Short-Term Technical Setup: Falling Wedge Formation
XRP price four-hour chart shows the formation of a falling wedge pattern, a structure often associated with bullish reversals.
This pattern suggests a potential move upward in the short term if XRP crypto breaks above the wedge’s upper boundary.
Resistance is currently located at $2.36. If breached, it may trigger a near-term rally to $2.59. The next stage of upward price movement may begin if buying volume continues to rise during the breakout point thus matching long-term bullish forecasts.
However, failure of XRP to maintain a $2.13 support level will result in a possible price retracement toward $1.96. The current setup, combined with whale activity and long-term technical formations, places XRP price in a favorable position.
The post XRP Price Set for a 2900% Rally As Indicators Turn Bullish? appeared first on The Coin Republic.
0
0


 Manage all your crypto, NFT and DeFi from one place
Securely connect the portfolio you’re using to start.


0
0

0
1
